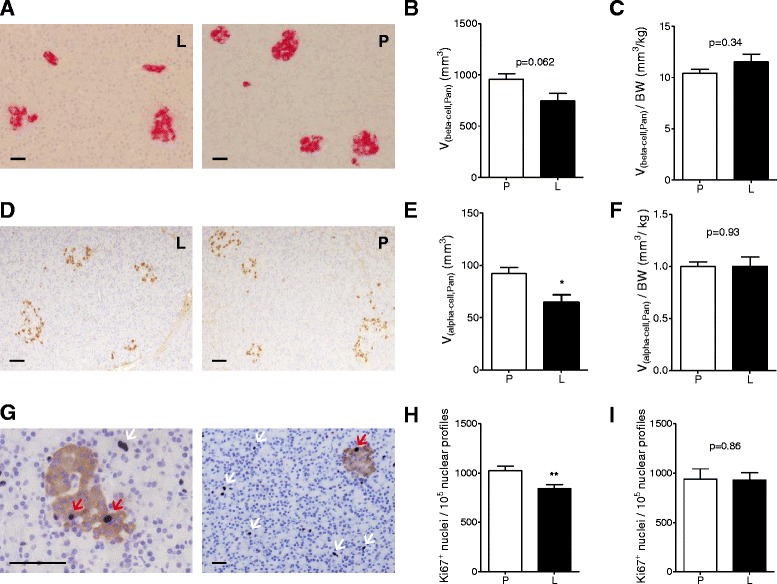
Figure 5.

Quantitative-stereological analyses of pancreata from liraglutide- and placebo-treated GIPR dn transgenic pigs. Representative histological pancreas sections of (A) immunohistochemical staining for insulin and (D) glucagon as well as (G) double immunohistochemical staining for Ki67 (blue) and insulin (brown) of liraglutide- (L) and placebo-treated (P) GIPRdn transgenic pigs, red arrow: proliferating beta-cell, white arrow: proliferating acinus-cell, scale bar = 50 μm. (B) Total beta-cell volume [V(beta-cell, Pan)] and (C) total beta-cell volume related to body weight [V(beta-cell, Pan)/BW] as well as (E) total alpha-cell volume [V(alpha-cell, Pan)] and (F) total alpha-cell volume related to body weight [V(alpha-cell, Pan)/BW]. (H) Beta-cell proliferation rate and (I) acinus-cell proliferation rate. Data are means ± SEM, *: p < 0.05, **: p < 0.01.
