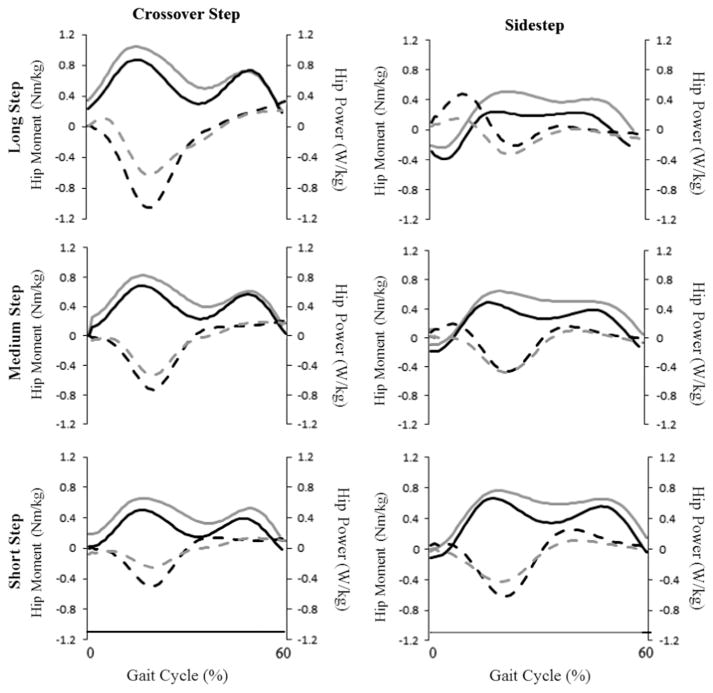
Fig. 2.
Ensemble moment and power plots of younger and older adults. Average frontal plane hip joint moment (solid line) and powers (dashed line) during the stance phase of the gait cycle for crossover steps (left column) and sidesteps (right column) for long lateral steps (top row), medium lateral step (middle row) and short lateral steps (bottom row). Mean ensemble curves of older adults (gray) and younger adults (black) are illustrated. Positive values for frontal plane hip moment relate to hip abduction while negative power relates to power absorption.

