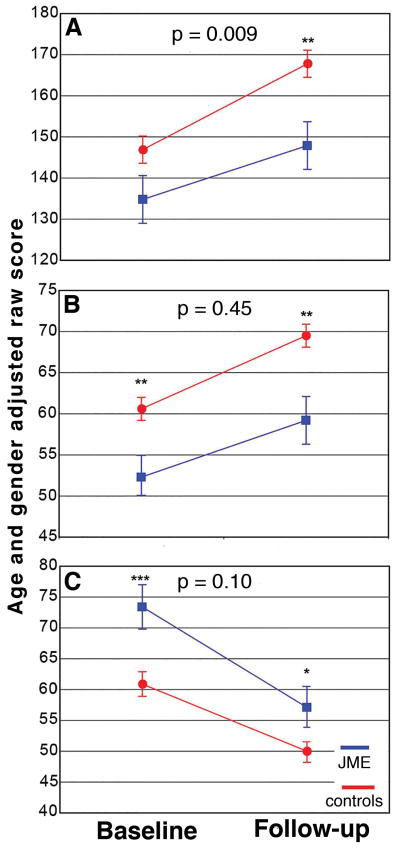
Figure 1.
Plots of prospective changes in age- and gender-adjusted raw scores in intelligence (A), psychomotor speed (B), and response inhibition (C) for the JME group (blue line) and healthy controls (red line). P-values of group by time interactions are denoted on top of each plot. Significant group differences at baseline and follow-up are denoted by asterisks (*=p<0.05; **=p<0.01, ***=p<0.001).

