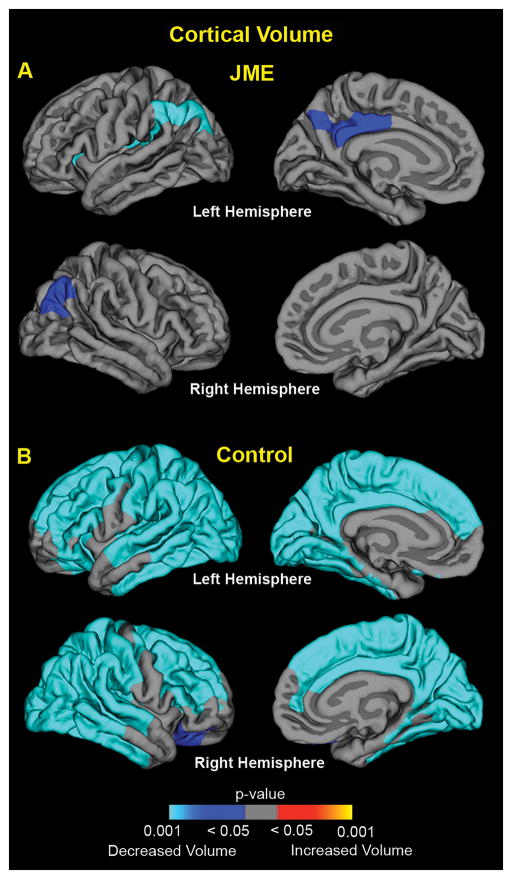
Figure 2.
Prospective cortical volume changes in the new-onset JME group (A) and the healthy control group (B). The significance of changes is shown as p-value maps (corrected for multiple comparisons) of increased (yellow/orange regions) and decreased (blue regions) cortical volume over the two-years.

