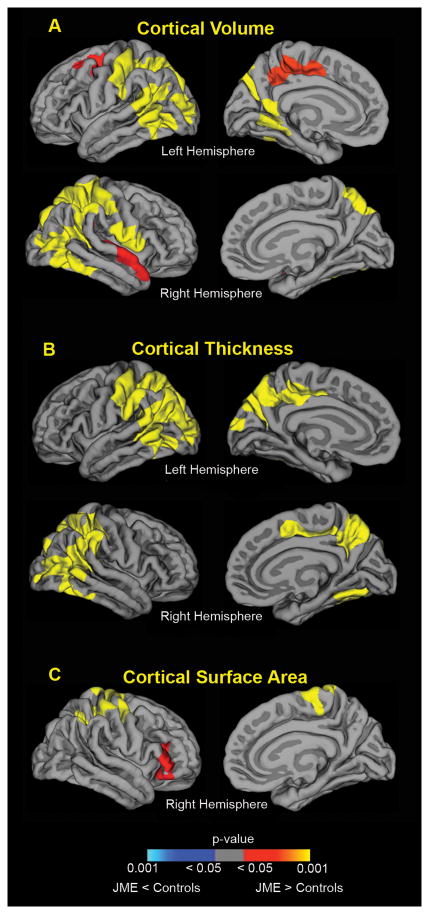
Figure 3.
Differences in cortical development between JME and healthy controls. JME group demonstrated higher cortical volume and cortical thickness in the bilateral fronto-parietal-temporal association regions over the prospective 2 years. JME group also showed greater expansion of surface area in right parietal and frontal regions, compared to controls. Color maps indicate significant p-values (corrected for multiple comparisons), with yellow/orange colors denoting JME group had higher values (JME > controls) and blue areas denoting lower values (JME < controls), relative to controls.

