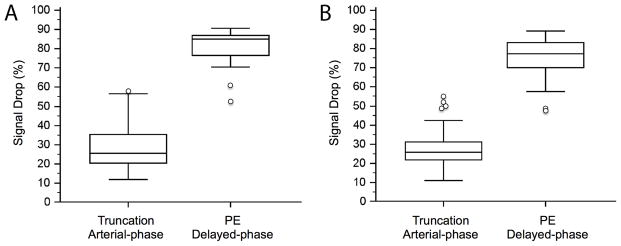
Fig. 2. Boxplots of percent-signal drop of truncation artifact and true pulmonary embolism of arterial-phase and delayed-phase MRA.

Truncation artifacts showed the same median signal drop of 26% on arterial-phase (range 12 – 58%) and on delayed-phase MRA (range 11 – 55%). True pulmonary embolism showed a significantly higher signal drop of 85% (range 53 – 91%) and 77% (range 47 – 89%), respectively (p<0.0001 for both). Note the small overlap between the percent-signal drop of truncation artifacts and true pulmonary emboli.
