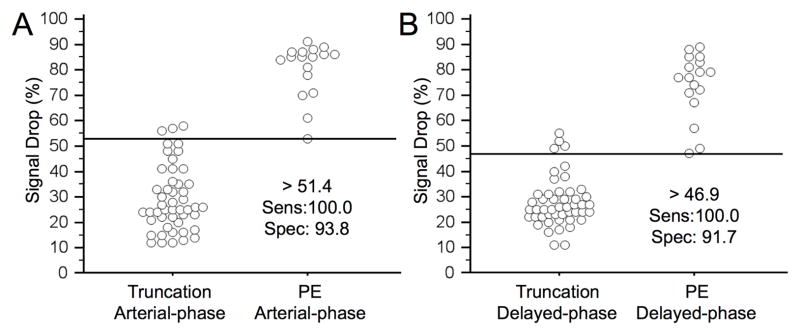
Fig. 6. Aligned dot plot analyses of %-signal drop and ROC derived threshold values.

ROC analyses exhibited an ideal threshold of 51% and of 47%-signal drop at arterial-phase MRA and delayed-phase MRA, respectively, with 100% sensitivity and >90% specificity for differentiation of truncation artifact and pulmonary embolism.
