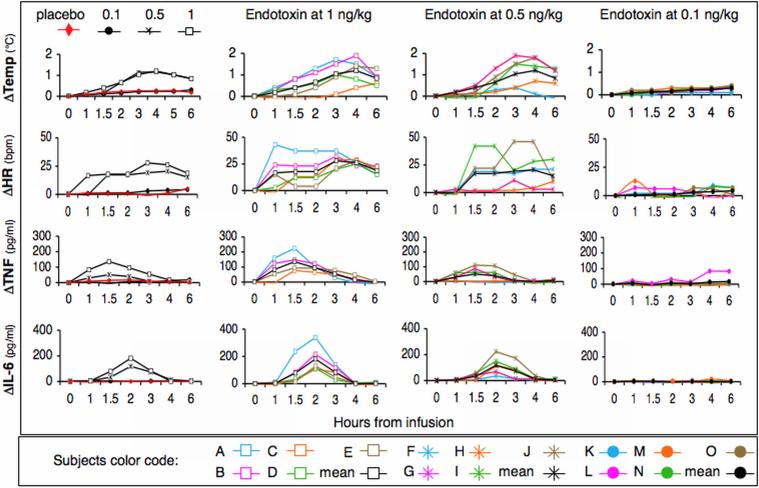
Figure 1.
In vivo endotoxin-induced responses in humans. Subjects (n=5 per group) were challenged with saline (placebo group) or endotoxin at 1-, 0.5- or 0.1-ng/kg. Subjects were assigned a unique color and symbol code that can be followed throughout Figures 1-4. Endotoxin-induced systemic changes in core body temperature, hear rate (HR), and cytokine (IL-6 and TNF) responses were monitored at the indicated time post-infusion. The panels in the left hand column represent mean responses. All other panels show dose- and time-dependent responses per subject.

