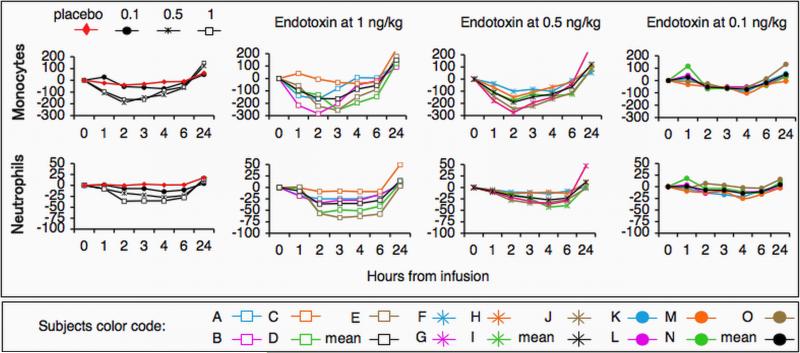
Figure 2.
In vivo endotoxin-induced changes in TNF-receptor II expression. Leukocytes were isolated from subjects challenged with endotoxin at 1-, 0.5- or 0.1-ng/kg. TNF-receptor II (TNF-R) expression on monocytes and/or neutrophils surface was determined by flow cytometery. Data are expressed as changes in arbitrary fluorescent units (AFU) from time 0. The panels in the left hand column represent mean responses. All other panels show dose- and time-dependent responses per subject.

