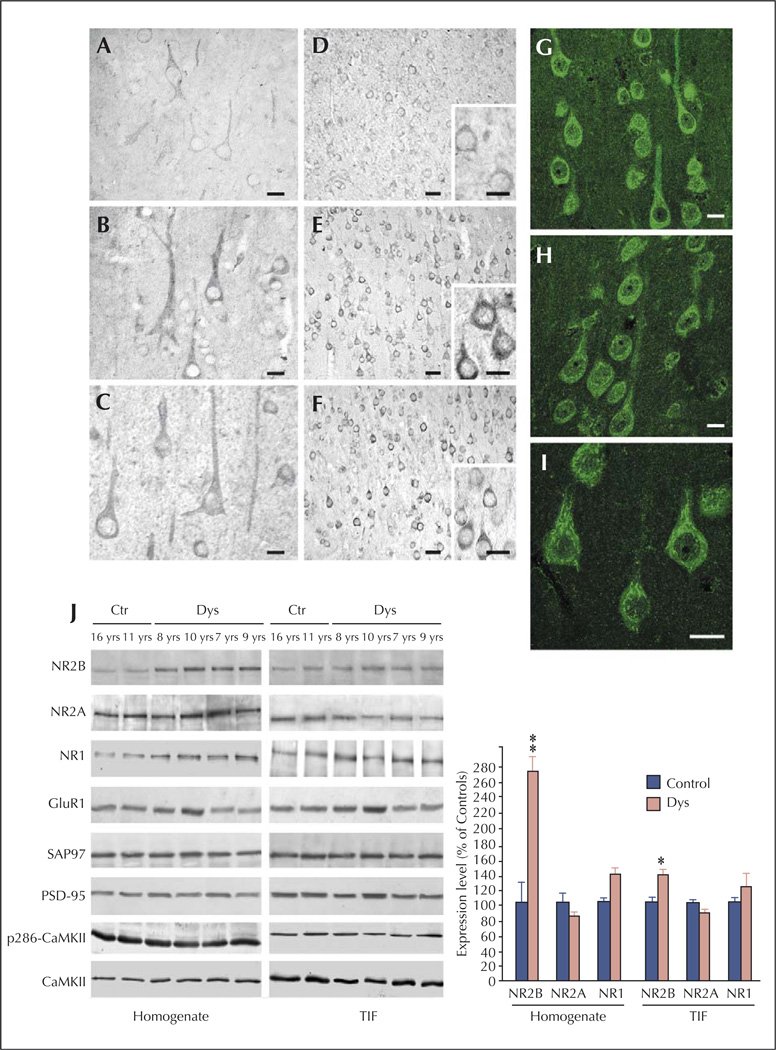
Figure 3.
NMDA receptor expression and composition are altered in type IA FCD patients (from Finardi et al., 2006). A–F) NR1 (A–C) and NR2B signals (D–F) are more evident in cortical pyramidal neurons from FCD patients (B–C and E–F) in comparison with controls (A and D). G–I) Confocal immunofluorescence confirmed the increased NR2B signal in coarse granules within the cell body and apical dendrites of FCD IA pyramidal neurons. J) Western blot analysis of homogenate (left) and TIF (right) fractions from cortical specimens of FCD patients (Dys) and controls (Ctr). Note that NR2B expression levels are increased in all FCD patients, whereas NR2A (patient 8, aged 7 yrs) or GluR1 (patient 7, aged 10 yrs) expression levels are increased in some but not all patients. Statistical analysis reveals that NR2B was significantly increased in dysplastic versus control cortical areas (** p < 0.01 for the homogenate; * p < 0.05 for post-synaptic membranes). Scale bars: 20 µm (A–C); 50 µm (D–F; 20 µm in inserts); 20 µm (G–I).

