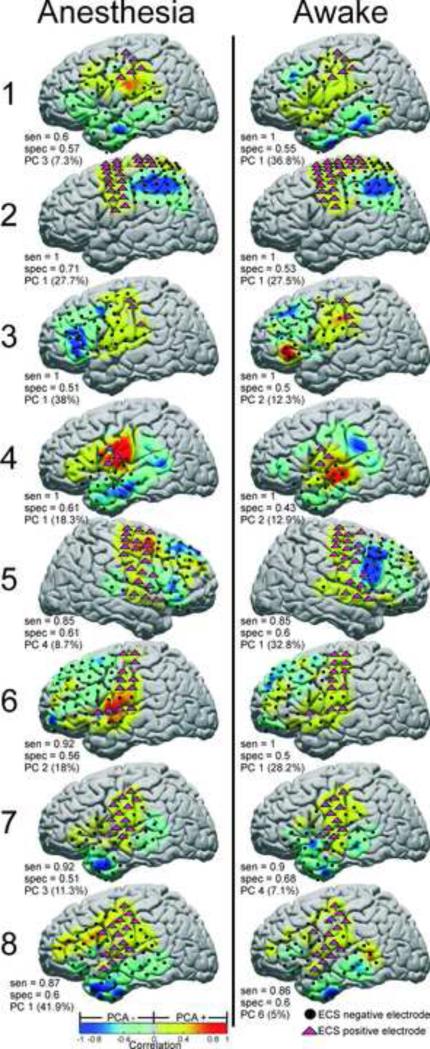
Fig. 4.
Principal component analysis applied to identification of SM cortex electrodes. PC based correlation maps are shown plotted on standardized brains, with independently tested ECS positive (magenta triangles) and negative (black circles) electrodes superimposed. For each PC, SCP correlation strength is indicated by the warm/cool colormap. Electrodes with correlation greater than zero were labeled as “positive’ for SM cortex. The sensitivity, specificity, and PC number with percent variance explained are shown for the 8 subjects in both the anesthetized and awake states. Electrodes which were not tested by ECS or were discarded because of artifact are not shown.

