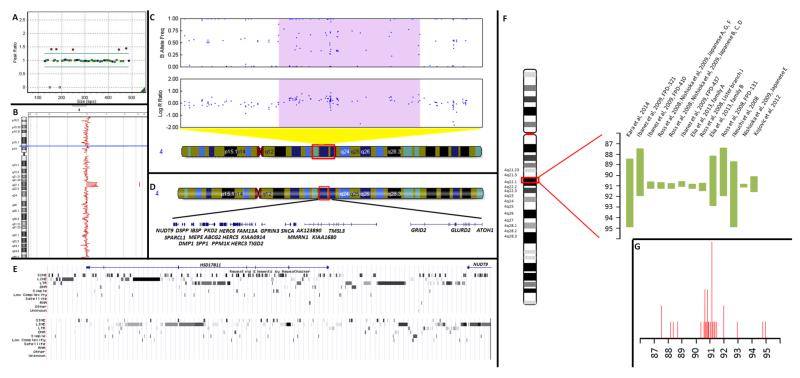
Figure 2. ‘Genetic findings’.
A) MLPA results depicting the duplication. B) Minimum duplicated region as identified by the CGH array (chr4:88,349,207-94,751,141, HB37). C) Minimum duplicated region as identified by the Immunochip (chr4: 88,231,429-94,816,144 HB37) with an increased logR ratio and probes forming 4 distinct genotype clusters 46. Region depicted in figure is chr4: 83,666,791-97,713,411 (HB37). D) Genes included within the minimum duplicated region (chr4:88,349,207-94,751,141, HB37) as identified by the CGH array. E) Breakpoint regions and repetitive sequences identified through UCSC repeat masker. Upper panel centromeric (chr4:88,249,207-88,349,207), lower panel telomeric (chr4: 94,751,141-94,851,141). F) Comparison of the length of the duplicated/triplicated region between our case and published cases (band sizes are approximate). Sizes represent minimum length based on Human Build 36. G) Location of breakpoints. Height of peak corresponds to the number of cases with a breakpoint in the particular region. Breakpoint location could correspond to regions of recombination hotspots 21,47. The case reported by Garraux et al (2012) 11 was excluded from both images.

