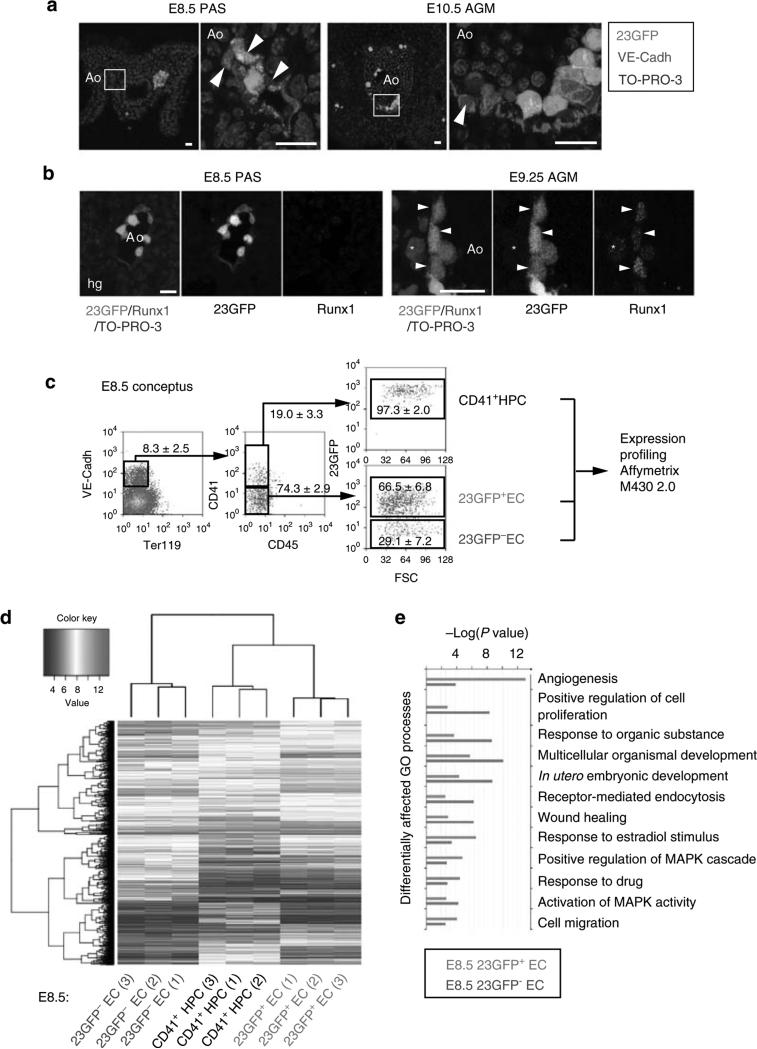
Figure 1. The Runx1 + 23 haematopoietic-specific enhancer marks a distinct subset of endothelium in mouse haemogenic sites.
(a) VE-Cadh immunostaining (red) and 23GFP transgene expression (green) in 10 μm cryosections through the posterior region of E8.5 (7–10 sp) and E10.5 (31–34 sp) 23GFP transgenic embryos. Nuclear stain (TO-PRO-3) in blue. Higher magnification images of the boxed areas show co-expression of VE-Cadh and 23GFP. Arrowhead: example of 23GFP expression in VE-Cadh+ endothelial cells. Scale bar, 20 μm. (b) Merged and single channel images of Runx1 immunohistochemistry on 23GFP expressing sections of E8.5 (10 sp) and E9.25 (23 sp). Arrowhead: 23GFP and Runx1 co-expression, asterisk: Runx1 but no 23GFP expression. Ao, dorsal aorta; Hg, hind gut; Vit, vitelline artery; scale bar, 20 μm. (c) Flow cytometric analysis further corroborates 23GFP expression in E8.5 (4–12 sp) VE-Cadh+ Ter119– CD45– CD41– endothelial cells. Representative dot plots and mean percentages±s.d. are from three independent analyses of pooled tissues. Sort gates are indicated. (d) Hierarchical clustering and heatmap of whole-genome gene expression data (Affymetrix) from 23GFP+ and 23GFP– VE-Cadh+ Ter119– CD45– CD41– EC and 23GFP+VE-Cadh+ Ter119– CD45– CD41+ HPC. Numbers in parentheses indicate the biological sample. There are 516 unique annotated probe IDs differentially expressed between 23GFP+ and 23GFP– ECs (see Supplementary Data 1 for the full list). The top differentially affected GO processes overrepresented in this list are shown in (e).

