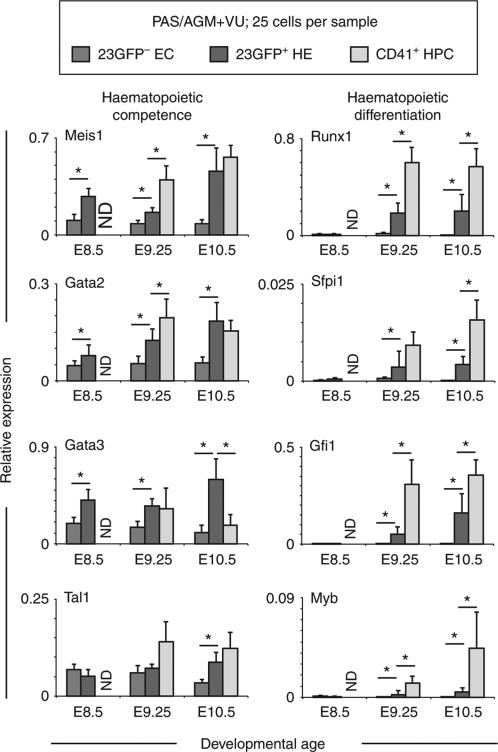
Figure 4.
Fluidigm qRT–PCR analysis of 23GFP+ (green) and 23GFP– (blue) VE-Cadh+Ter119– CD45– CD41– ECs and/or VE-Cadh+ Ter119– CD45– CD41+ HPCs (grey) from E8.5 (5–9 sp), 9.25 (18-22 sp), and 10.5 (32–36 sp) PAS/AGM + VU. Data are normalized to the mean of the reference genes Hprt1 and BAct and are the mean±s.d. of a total of 4–7 pools of 25 cells from two independent experiments. ND, not done. *P<0.05 (Student's t-test).

