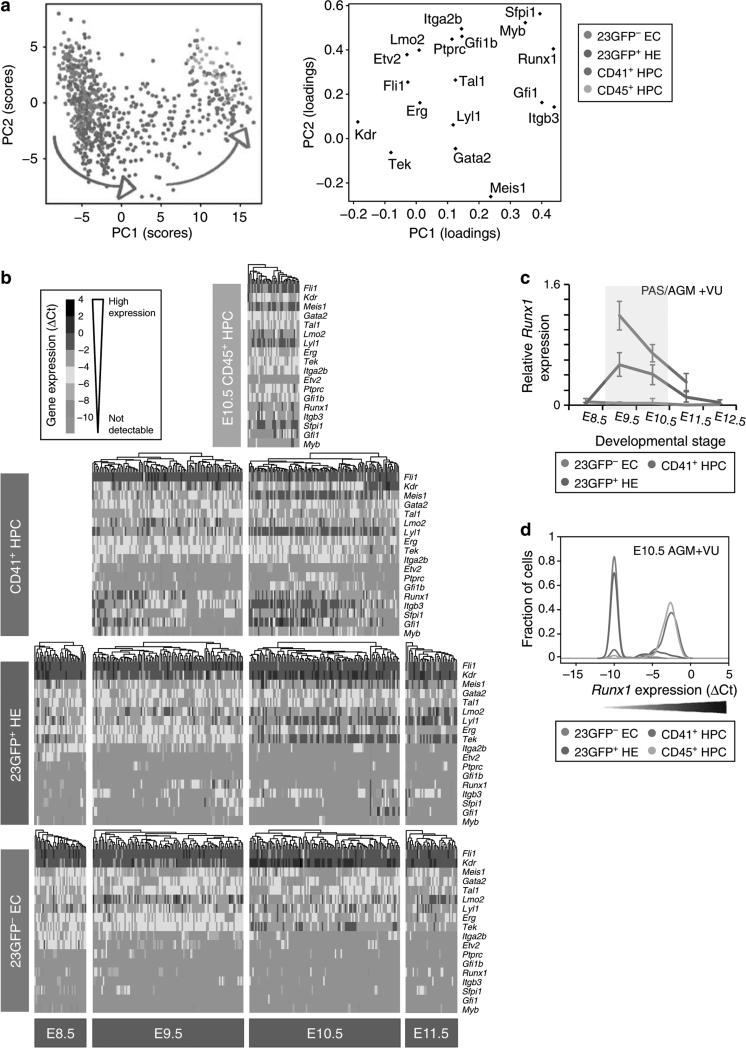
Figure 5. Single-cell expression analysis reveals the transitory nature of 23GFP+ HE.
(a) Principal component projections of all 803 cells in the first and second components. Data represent all single cells, from all time points, analysed together. Individual cells were coloured retrospectively based on the phenotype they were sorted on. Arrows indicate the direction of maturation of 23GFP+ HE cells (green) and CD41+ HPC (red). (b) Heat maps showing the expression of the 18 endothelial- and haematopoietic-related genes in single cells for all cell types analysed. The data are ΔCt to the mean of Atp5a1 and Ubc reference genes and colour coded as ΔCt steps. Columns represent individual cells, displayed after hierarchical clustering so that similar expression profiles are closer together, and rows represent the individual genes ordered based on the hierarchical clustering of all data. (c) Narrow window of Runx1 expression in 23GFP+ HE. Data are normalized to the mean of the reference genes Hprt1 and Atp5a1 and are the mean±s.d. of a total of 4 to 6 pools of 25 cells from two independent experiments except E12.5 (one experiment with three pools of cells). E8.5 (6–13sp), E9.5 (19–26sp) and E10.5(32-38sp). (d) Kernel density plots of the single-cell data showing increasing Runx1 levels in EC, HE and HPC at E10.5.

