Figure 3.

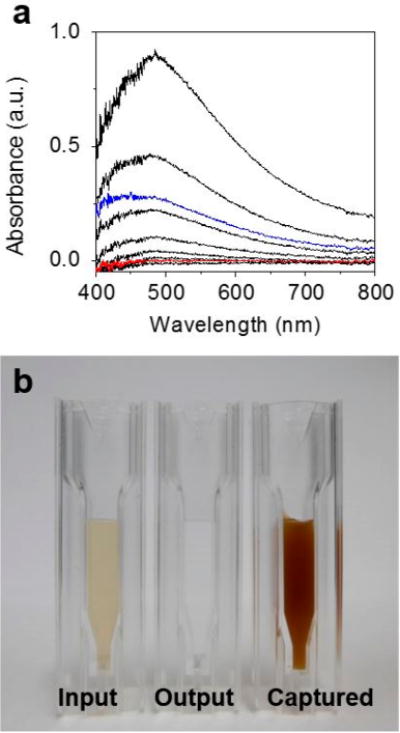
(a) UV–visible absorbance spectrum of the output MNC samples having a range of concentrations relative to the input sample concentration. The signals in black represent relative concentrations of 100%, 50%, 25%, 10%, 5%, 1%, and the baseline control, from top to bottom. The blue signal represents the output relative concentration obtained from a device prepared without spacers between the magnets, and the red signal represents the output relative concentration obtained from a device prepared with spacers. (b) Optical images of the MNC samples obtained from the input, output, and captured solutions in the HEMOS.
