Figure 5.
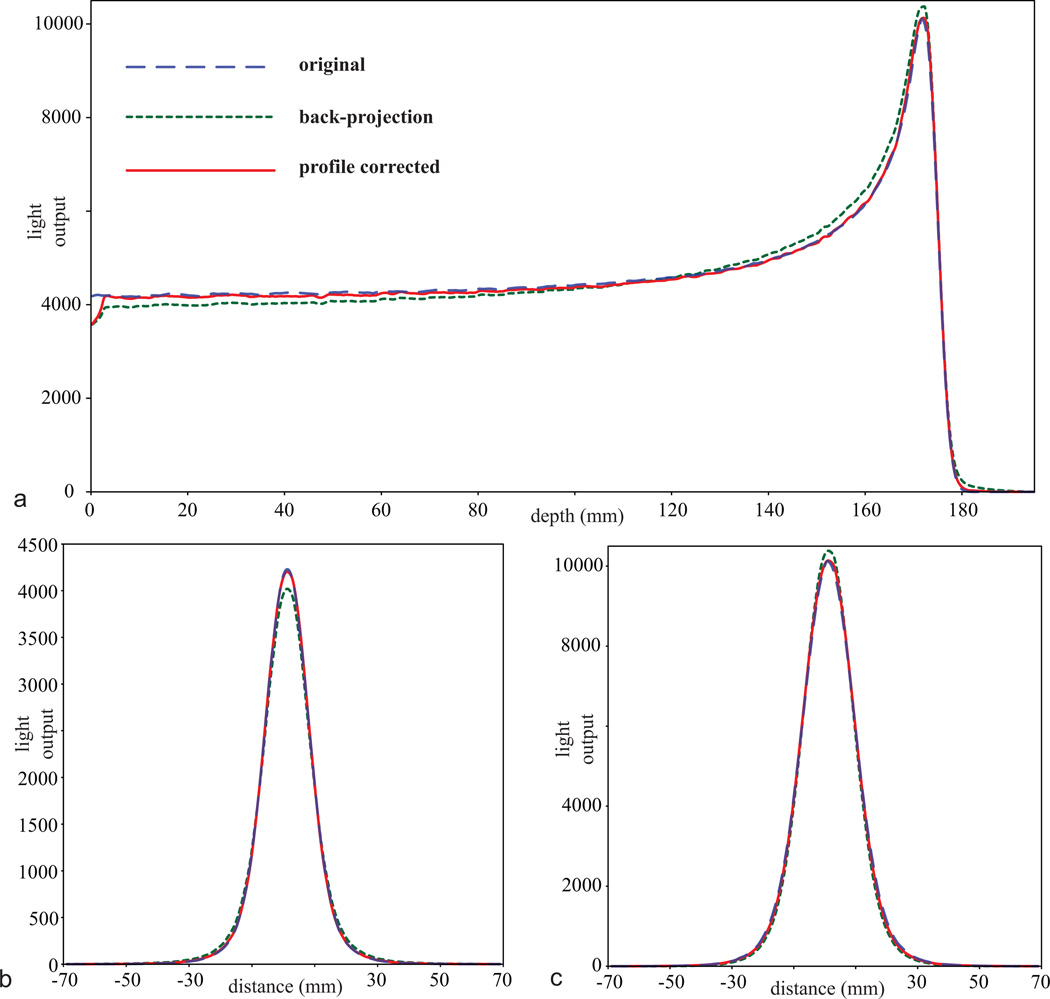
Light output profiles of the original single proton beam (blue dashed), the reconstructed volume using back-projection as the initial estimate after 20 iterations (green dotted), and the reconstructed volume using the profile-based initial estimate with correction factor (profile corrected) after 20 iterations (red solid), with (a) depth profiles at the center of the proton beam, (b) lateral profiles near the entrance at 15 mm depth, and (c) lateral profiles near the Bragg peak at 172 mm depth.

