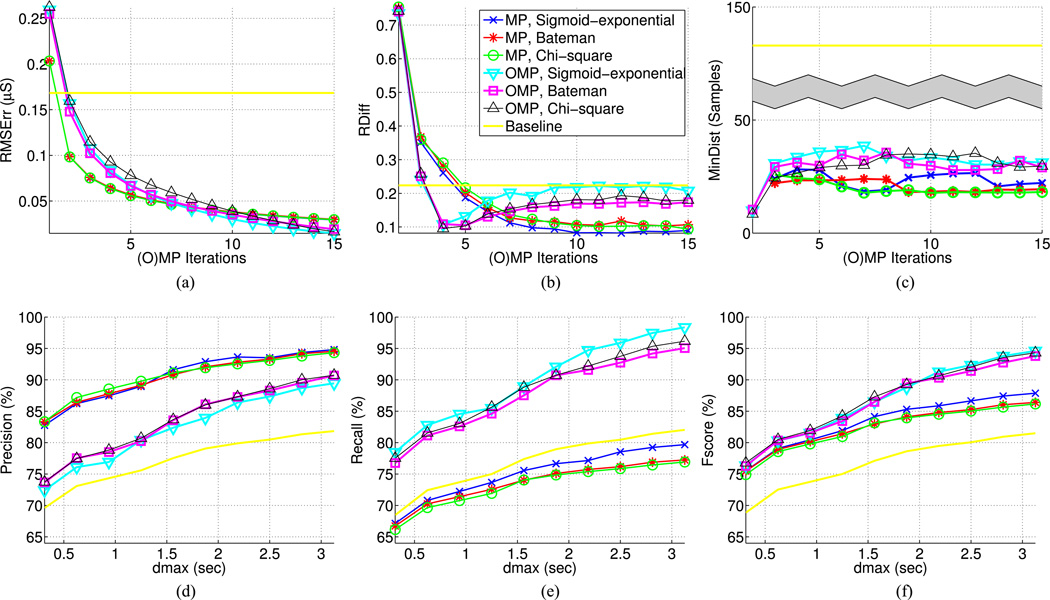
Fig. 5.
Signal reconstruction and SCR detection results. (a) Root mean square (RMS) error between original and reconstructed signal with respect to (w.r.t.) the number of (orthogonal) matching pursuit ((O)MP) iterations. (b) Absolute number of relative difference between real and estimated SCRs w.r.t. the number of (O)MP iterations. (c) Mean distance of estimated SCRs from their closest real SCR w.r.t. (O)MP iterations. (d), (e), (f) Precision, recall, and Fscore of SCR detection with 6 (O)MP iterations w.r.t maximum distance threshold dmax between real and detected SCRs, the latter ranging between 10–100 samples, or 0.3125–3.125 s. Results on Fig. (b)– (f) are reported based on a tenfold cross validation, during which SCR detection on the test set is performed using the parameter combination (dthr, Nb) that gave the best results on the training data, where dthr is the distance threshold for mapping estimated SCRs to the nearest signal peaks and Nb is the number of histograms bins for grouping the selected phasic atoms of each analysis frame. Same legend applies to all plots.

