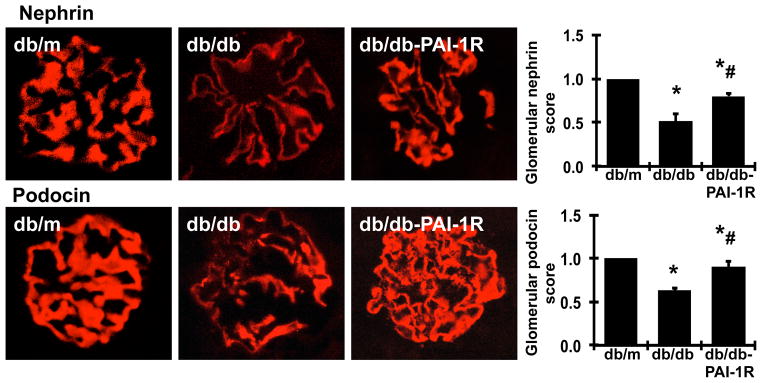
Figure 3. Effect of PAI-1R on immunofluorescent staining for glomerular nephrin and podocin at week 22.

Representative photomicrographs (original magnification × 400) of the glomeruli obtained at 22 weeks from a normal control mouse (db/m), a diabetic db/db mouse treated with PBS (db/db) and a diabetic db/db mouse treated with PAI-1R (db/db-PAI-1R). Graphic representation of the mean nephrin and podocin staining scores of each group is shown on the right. *P<0.05, vs. db/m. #P<0.05, vs. db/db.
