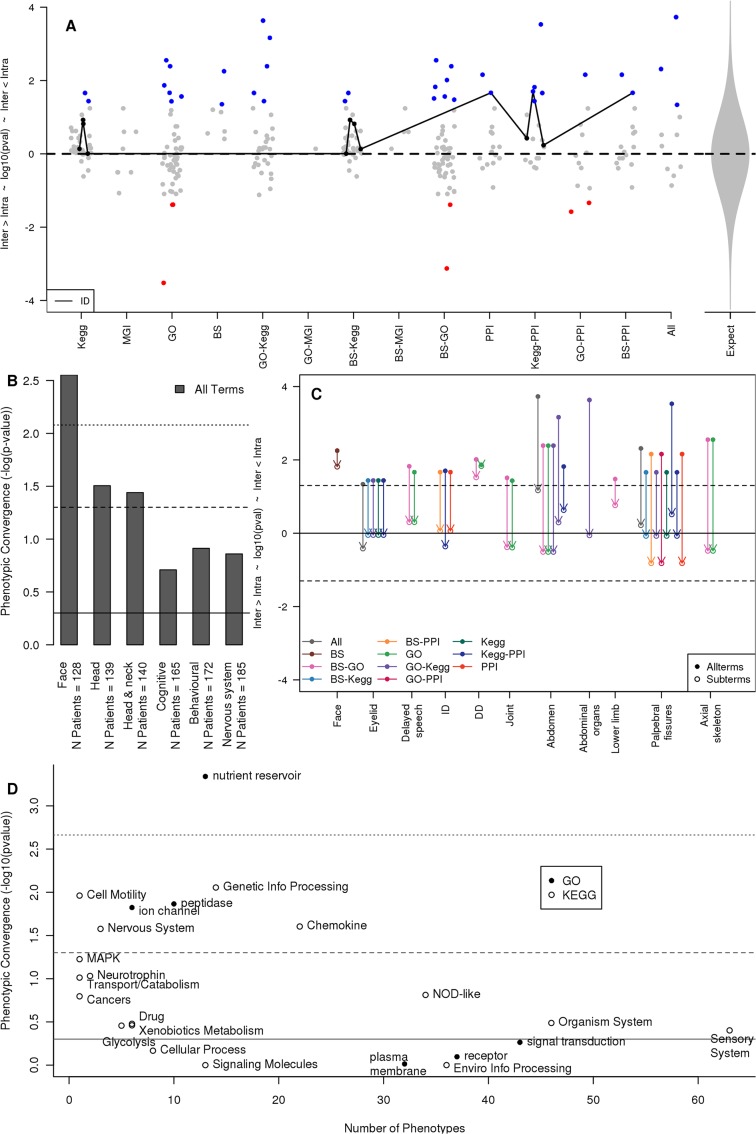
Fig 4. Phenotypic concordances amongst patients whose copy number variant genes contribute to the same functional associations and molecular pathways.
(A) Overall, patients with genes that contribute to the same functional association are phenotypically similar (p = 1 x 10⁻⁴). The Y-axis gives the significance of the overall phenotypic similarity amongst patients within a patient-phenotype group whose variant genes contribute to a functional association (Intra) as compared to those patients in the same phenotype group who do not contribute (Inter), with higher values indicating increasing relative similarity amongst association-contributing patients. Each point represents a single significant patient-phenotype group association, while the methods used to identify the association are shown on the X-axis (KEGG, MGI mouse KO phenotypes, GO, BS BrainSpan gene co-expression). Combinations of methods (e.g. GO-KEGG) illustrate the relative phenotypic similarity amongst patients possessing copy variant genes that individually contribute to multiple functional associations (see Results). “PPI” values are those among patients contributing the interacting molecular networks identified in Fig. 2 (see Results). Dots coloured blue or red indicate nominally significantly phenotypic similarity or dissimilarity, respectively. The black line connects all enrichments associated with the intellectual disability (ID) patient-phenotype group. (B) BrainSpan (BS) was the only pathway-resource to consistently identify phenotypically similar subgroups through a shared molecular association. Detail on the phenotypic similarities shown in Panel A. Solid line: p = 0.5, dashed line: p = 0.05, dotted line: p = 0.007 conferring significance after a Bonferroni correction. (C) The significant phenotypic similarities amongst patients who contribute to the same functional association are not derived from these patients presenting more specific subphenotypes of the original phenotype. Y-axis as in panel A. For all nominally significant enrichments in panel A (top, solid points) we recalculated the patient phenotypic similarities considering only child terms of the original HPO phenotype (open points connected to their respective solid point by an arrow). Points are grouped horizontally by HPO and coloured by enrichment-type. Solid line: p = 0.5, dashed line: p = 0.05. (D) In general, the fewer patient-phenotype groups that a functional enrichment term was associated with, the more phenotypically similar the patients associated with that functional term were. Patient-phenotype groups associated with the same KEGG pathway or GO term were combined and for each association the phenotypic similarity amongst those patients whose variant genes contributed to the given association was compared to those who did not contribute. Y-axis as in panel A. The number of patient-phenotype groups each functional association is associated with is given on the X-axis.

