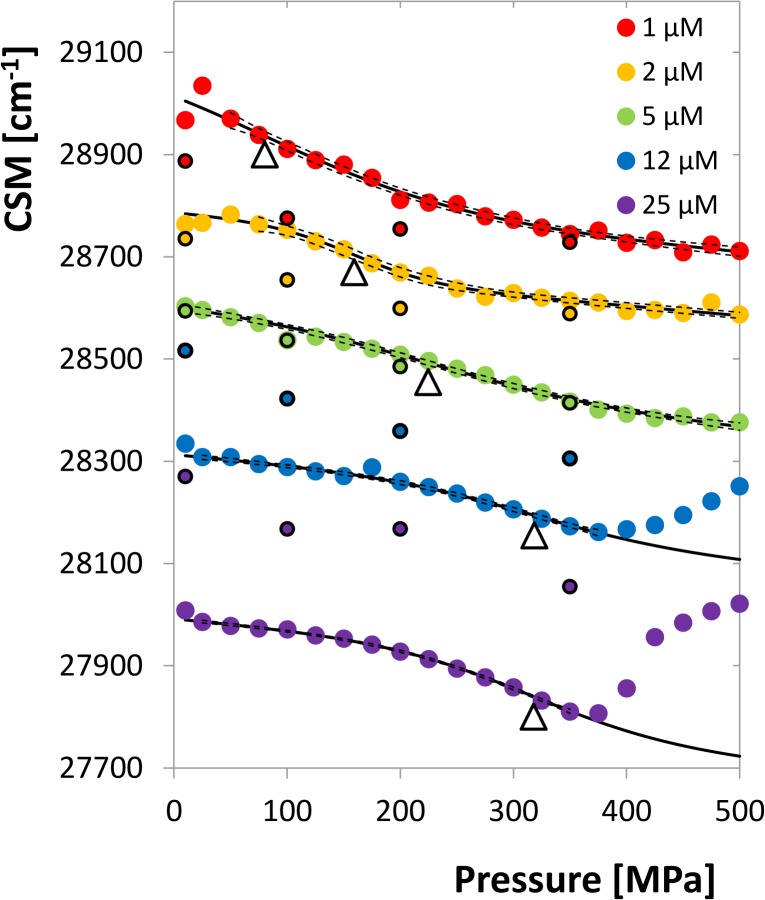
Fig 3. Centre of spectral mass of the emission spectra as a function of pressure for different HIV-1 protease concentrations.
The curves are shifted up or down by artificial additive constants for the sake of lucidity. Solid lines express the fitting curves, empty triangles indicate the inflex points. Dashed lines represent the 95% confidence bands of the regression curves. The high pressure regions of the curves for 12 and 25 μM dimer concentration are excluded from fitting as they are influenced by protein aggregation. The smaller circles with black bordering line indicate the CSM values for the subsequent release of pressure from the highest to the lowest value.

