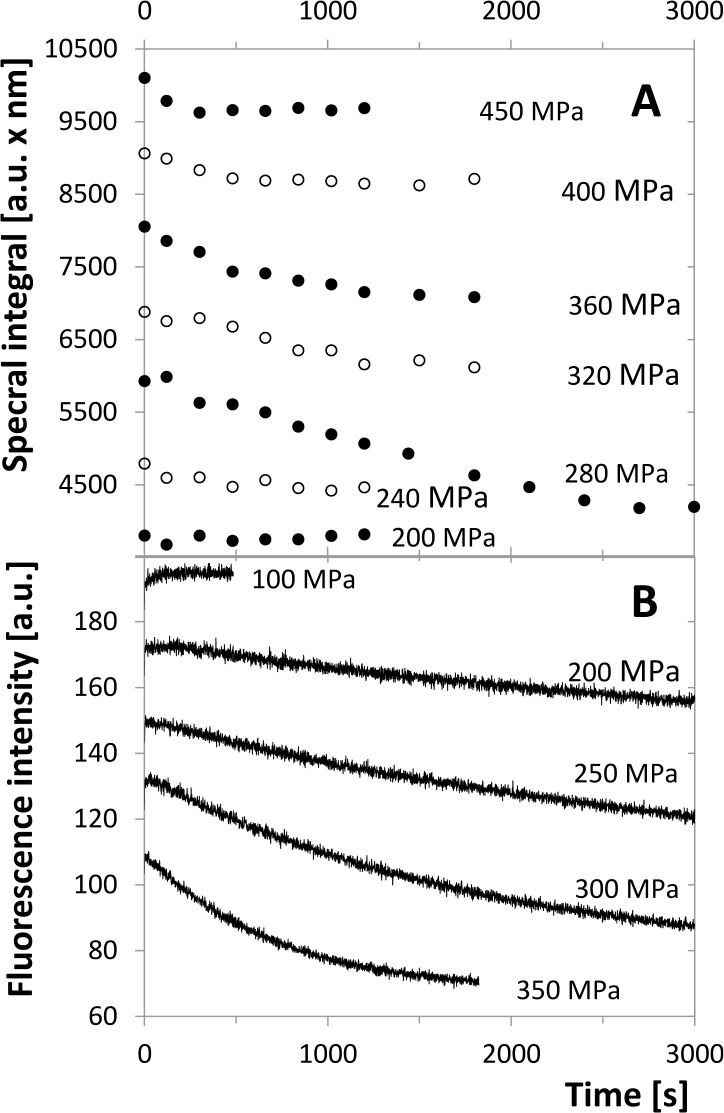
Fig 7. Time development of the emission intensity of the tryptophan fluorescence at λex = 280 nm.
In both panels the curves are shifted up or down by artificially chosen constant for better orientation in the graph. A. Spectral integral of spectra taken in time series for different pressures, each series with new protease sample, λem = 300–400 nm, dimer concentration 10 μM. B. Emission intensity at a single wavelength of λem = 350 nm for the dimer concentration of 5 μM.

