
Fig. 4.
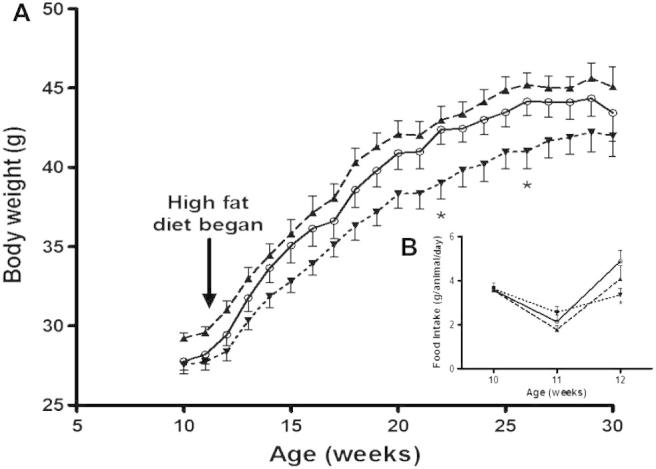
Effect of high fat diet on the body weight of sarcolipin over-expressing and FLAG-tagged sarcolipin expressing mice. (A) Male wild type (○, solid line), sarcolipin over-expressing (▴, dashed line) and FLAG-tagged sarcolipin expressing (▾, dotted line) mice were fed on a standard chow diet until 11 weeks of age after which they were transferred onto a high fat (60%) diet. Body weight was measured on a weekly basis. The bars indicate standard error of the mean, n = 14. ∗P < 0.05 for FLAG-sarcolipin overexpressing mice compared to control mice by one-way ANOVA followed by Dunnett’s test at 22 and 26 weeks of age. (B, inset) Food intake was measured during the transition from standard chow to high fat diet. The bars indicate standard error of the mean, n = 14. ∗P < 0.05 for FLAG-sarcolipin overexpressing mice compared to control mice by two-way ANOVA followed by Bonferroni multiple comparisons test.