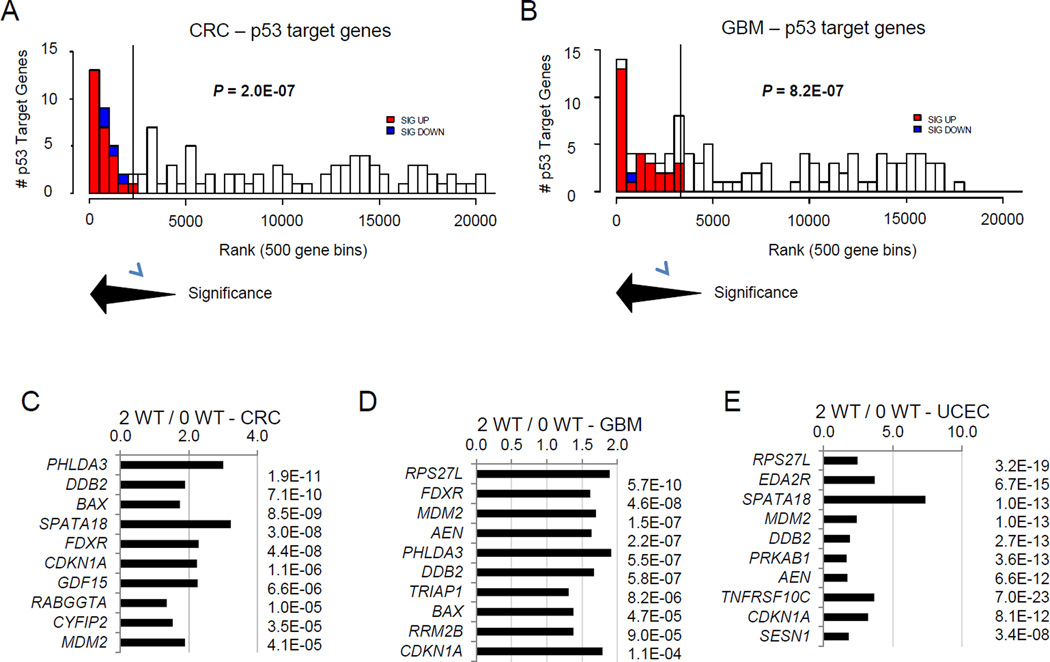
Figure 2.
A subset of p53-induced target genes is consistently upregulated in 2 WT TP53 cancers relative to 0 WT TP53 counterparts. (A) Overrepresentation of upregulated p53-induced target genes among the most differentially regulated genes in colorectal cancers (CRC) with 2 WT TP53 alleles. All genes were ranked in 500 gene bins by significance of differential RNA expression in 2 WT TP53 tumors versus 0 WT TP53 tumors. Numbers of p53-induced target genes are shown in each bin. Significantly upregulated p53 targets are indicated in red and significantly downregulated p53 targets are indicated in blue. A Fischer’s exact test (P = 2.0E-07) showed this over-representation of upregulated p53-induced target genes in the 2 WT TP53 tumors to be highly significant. (B) Over-representation of upregulated p53-induced target genes among the most differentially regulated genes in glioblastomas (GBM) with 2 WT TP53 alleles. Analyses were performed as described for panel A. (C–E) For each of the cancers in C-E, the ten p53-induced target genes most differentially expressed were ranked by significance (P values after t test) and the ratio of mean expression of each gene in 2 WT TP53 tumors relative to 0 WT TP53 tumors is indicated. (C) colorectal carcinomas (CRC). (D) glioblastomas (GBM). (E) Endometrial carcinomas (UCEC).

