
Figure 3.
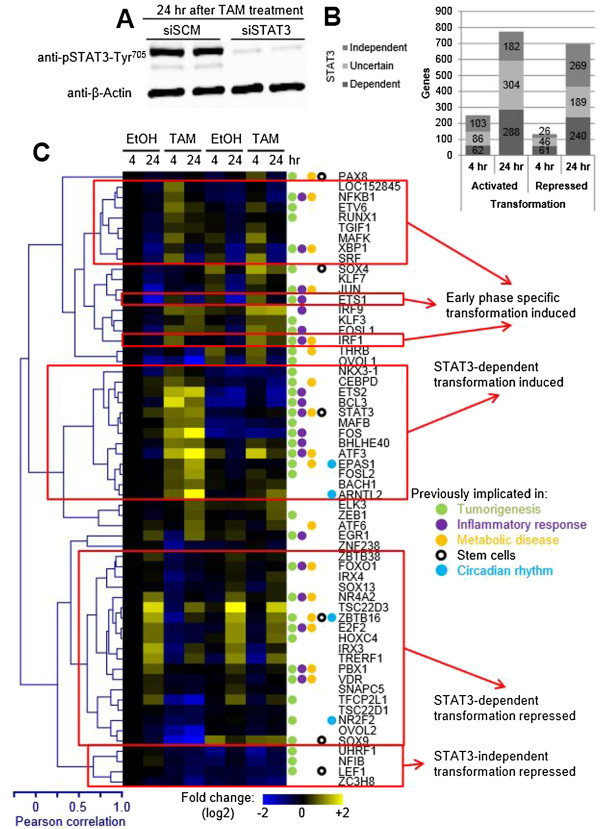
Differentially expressed transcriptional regulators during transformation. (A) Western blots of protein extracts from TAM-treated MCF10A-ER-Src cells done in parallel to RNA samples used for expression microarray analysis. STAT3 protein levels are reduced >25-fold upon siSTAT3 knockdown by 24 h. (B) The numbers of genes differentially up- or downregulated during transformation at 4 and 24 h post ER-Src activation and their dependence on STAT3. (C) Shown are the RNA expression levels at 4 and 24 h post EtOH or TAM treatment in samples transfected with siSCM (scrambled control) or siSTAT3. RNA levels are expressed as fold change over 4-h EtOH- and siSCM-treated samples. All TFs differentially regulated (P value <10−4, >log2 0.5-fold change) upon ER-Src activation at 4 or 24 h post TAM treatment in siSCM-transfected cells. TFs were clustered, and red boxes indicate TFs whose transcriptional response to treatments is correlated. Those TFs known to be involved in tumorigenesis, inflammatory response, metabolic disease, “stemness,” and the circadian rhythm are indicated by colored circles.