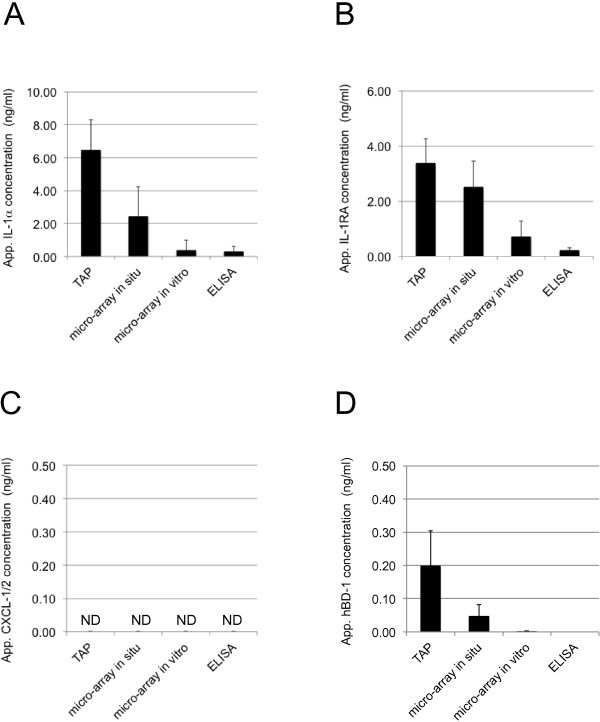
Figure 7.

Measurements of IL-1 α, IL-1RA, CXCL-1/2 and hBD-1 from healthy skin using TAP and from skin lavage techniques. TAP measurements of IL-1α, IL-1RA, CXCL-1/2 and hBD-1 from healthy skin were analyzed and compared with three different methods using skin lavage. See text for details. Signal intensities for the different methods were compared to signals obtained using fixed concentrations of recombinant IL-1α, IL-1RA, CXCL-1/2 and hBD-1 captured in solution. In the graphs, it is clearly visible that TAP is the most sensitive method for the detection of IL-1α (panel A), IL-1RA (panel B) and hBD-1 (panel D) on skin. CXCL-1/2 (panel C) could not be detected by any of the methods. Each data point in the graphs represents the results of two spots analyzed on 20 TAP’s (N = 10). Y-axis: Apparent concentration of IL-1α, IL-1RA, CXCL-1/2 or hBD-1 on skin in ng/ml. X-axis: Incubation time on skin in minutes. Error bars on graph present standard deviation of analyzed data points (N = 10).
