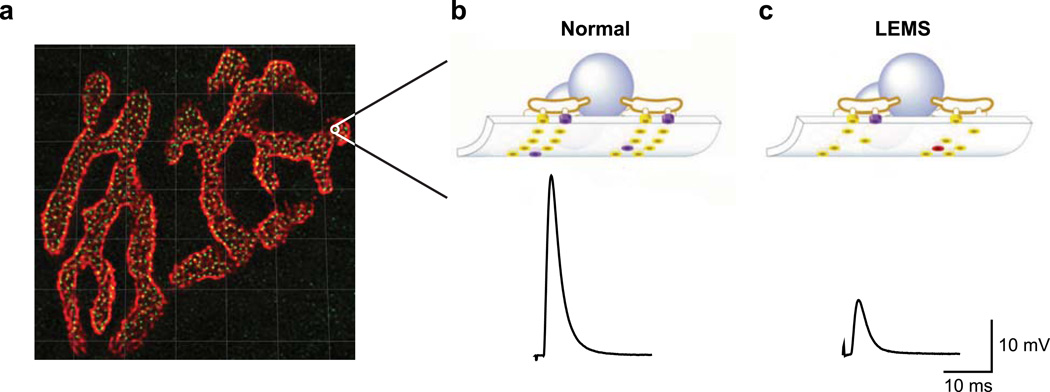
Fig. 1.
Active zone organization in healthy and LEMS model NMJs. a A single mouse NMJ showing postsynaptic acetylcholine receptors (red) and presynaptic active zone neurotransmitter release sites (green). Grid lines = 5 µm. b Schematic of an individual active zone (top) along with a sample average end plate potential (EPP; a measure of the strength of neurotransmitter release) trace (bottom) from a healthy mouse NMJ. c Schematic of an individual active zone (top) along with a sample average EPP trace from a LEMS model mouse NMJ (bottom). Schematics of active zones (b, c) include synaptic vesicles (blue spheres), P/Qtype Ca2+ channels (purple cylinders), other Ca2+ channel subtypes (red cylinders) and active zone proteins other than Ca2+ channels (yellow cylinders). a Modified from Ref. [17]; b,c modified from [28; Copyright 2003 National Academy of Sciences, USA]

