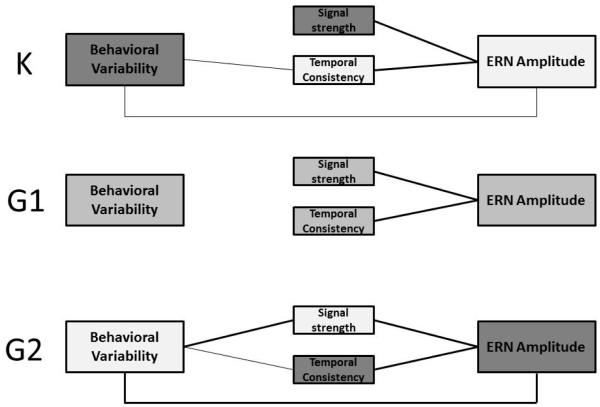
Figure 2.
Concurrent associations among ERN amplitude, signal components, and behavioral variability. Bold lines reflect significant correlations whereas thin lines reflect associations at the trend level. Developmental changes in average levels across the 3 years are depicted by changes in shading where darker boxes represent higher values.

