
Figure 2. Mean activation to each emotion type in the mPFC and PCC regions (i.e., seeds for the PPI analysis) showing significant between-group differences on the task (FACE-OVAL).
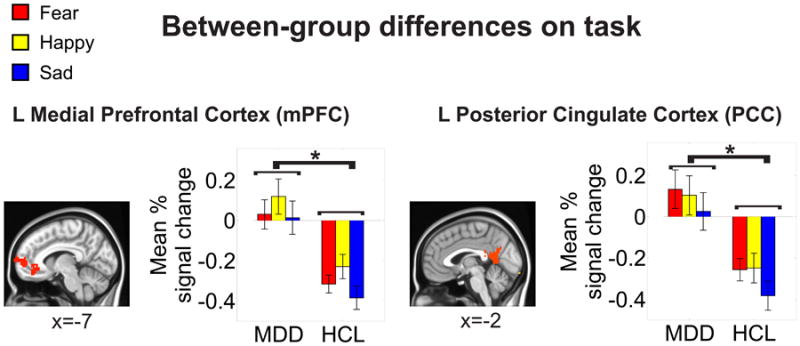
Mean percentage signal change to each condition (FEAR-OVAL, HAPPY-OVAL, SAD-OVAL) was extracted and subjected to post-hoc t-tests (Fisher's LSD). These post-hoc t-tests indicated a main effect of group at p<0.05 (denoted by *). These areas survived correction for multiple comparisons at a cluster-wise threshold of p<0.05. Locations are reported in MNI coordinates (radiological convention). See Figure S1 and Table S2 for a full summary of the between-group differences on the task.