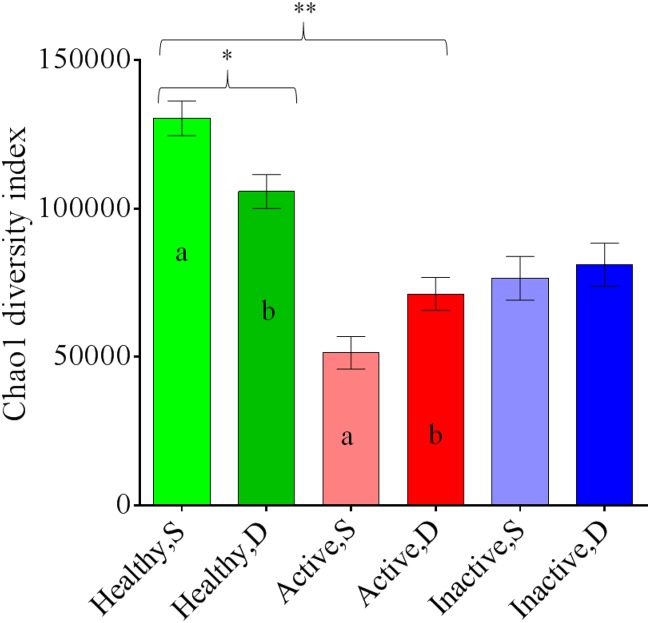
Fig 5. Bar graph illustrating the mean Chao1 index for superficial (S) and deep (D) strata samples of healthy skin, active digital dermatitis lesions, and inactive digital dermatitis lesions.
Error bars represent standard errors. One asterisk means a significant difference (*P < 0.01) between healthy skin and lesion types. Two asterisks mean a significant interaction (**P < 0.01) for sample and lesion types. Different letters (a, b) indicate significant differences between different strata within a sample type.

