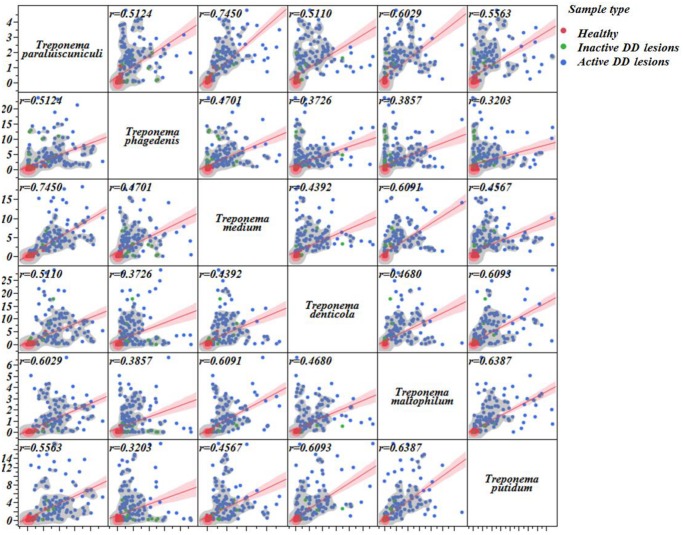
Fig 10. Linear correlation matrix illustrating the associations among all Treponema species that were highly associated with digital dermatitis.
Linear correlation line (red line) and respective 95% C.I. (shaded red) as well as correlation coefficients for each association (upper left corner) are provided. A nonparametric density contour was used to illustrate how healthy (red dots), inactive (green dots), and active digital dermatitis (blue dots) samples are concentrated on each graph.

