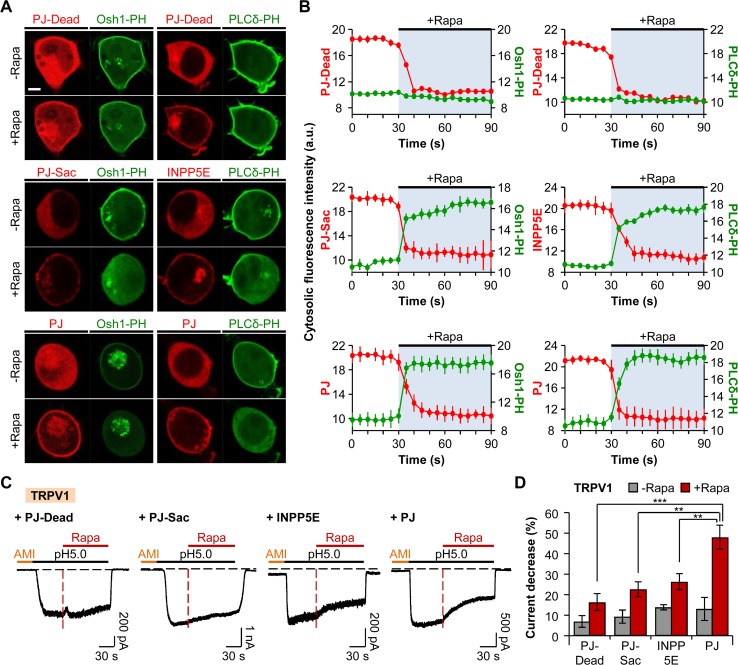
Fig 1. The activity of TRPV1 is dependent on phosphoinositides.
(A) Confocal images of cells expressing PJ-Dead (top), PJ-Sac (middle), INPP5E (middle), or PJ (bottom) with LDR and respective biosensors for PI(4)P (Osh1-PH-GFP) or PI(4,5)P2 (PLCδ1-PH-GFP). Images before and after the addition of rapamycin (1 μM) for 60 s (Scale bar, 5 μm). (B) Cytosolic fluorescence intensities of RFP (red) and GFP (green) for the cells in (A). The values of the Y-axis use an arbitrary unit. Cells expressing PJ-Dead (top), PJ-Sac (middle), INPP5E (middle), or PJ (bottom) (n = 3, respectively). (C) TRPV1 currents triggered by prolonged extracellular pH drop to 5.0 for 150 s. Rapamycin (1 μM) was co-applied for 90 s during the acid stimuli. Amiloride (300 μM) was pretreated for 30 s before the pH pulse. Black dashed line indicates the zero current level. Red dashed line indicates the point of rapamycin application. (D) Percentage of current decrease in (C) during 45 s of acidification before (grey) and after (red) rapamycin addition (n = 12 for PJ-Dead; n = 14 for PJ-Sac; n = 12 for INPP5E; n = 10 for PJ). ** P < 0.01 and *** P < 0.001, with two-way ANOVA followed by Bonferroni post-hoc test and one-way ANOVA followed by Bonferroni post-hoc test. Data are mean ± SEM.

