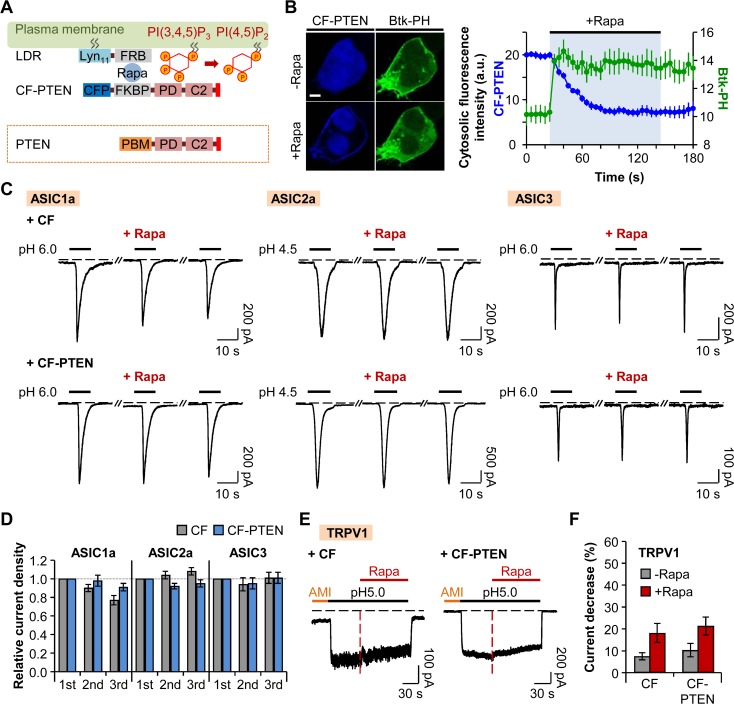
Fig 4. Neither ASICs nor TRPV1 activities are affected by depletion of PI(3,4,5)P3.
(A) CF-PTEN is rapidly recruited to the plasma membrane anchor LDR by dimerization of FRB and FKBP upon addition of rapamycin, and the PD domain of CF-PTEN specifically dephosphorylates PI(3,4,5)P3 to PI(4,5)P2. Red bar in the C-terminal tail of PTEN indicates PDZ-binding domain. (B) Confocal images of cells expressing LDR, CF-PTEN, and Btk-PH-GFP before and after the addition of rapamycin (1 μM) for 120 s (Scale bar, 5 μm) and cytosolic fluorescence intensities of CFP (blue) and GFP (green) (n = 3). The values of the Y-axis use an arbitrary unit. (C) ASIC current traces triggered by extracellular acidification in cells expressing LDR and CF (lacking PTEN) or CF-PTEN. Rapamycin (1 μM) was bath-applied for 60 s, and then normal extracellular solution was perfused for 10 s right before the second pulse to minimize possible side effects of rapamycin. Dashed line indicates the zero current level. (D) Relative current density measured for the cells in (C) (CF (n = 8), CF-PTEN (n = 7) for ASIC1a; CF (n = 8), CF-PTEN (n = 8) for ASIC2a; and CF (n = 10), CF-PTEN (n = 10) for ASIC3). Current density of each pulse was divided by that of the first pulse. There is no statistical significance with two-way ANOVA followed by Bonferroni post-hoc test. (E) TRPV1 currents in response to pH drop in the cells expressing LDR and CF or CF-PTEN. Rapamycin (1 μM) was co-applied for 90 s during the acid stimuli. Amiloride (300 μM) was pretreated for 30 s before the pH pulse. Black dashed line indicates the zero current level. Red dashed line indicates the point of rapamycin application. (F) Percentage of current decrease in (E) during 45 s of acidification before (grey) and after (red) rapamycin addition (n = 9 for CF; n = 10 for CF-PTEN). Data are mean ± SEM.

