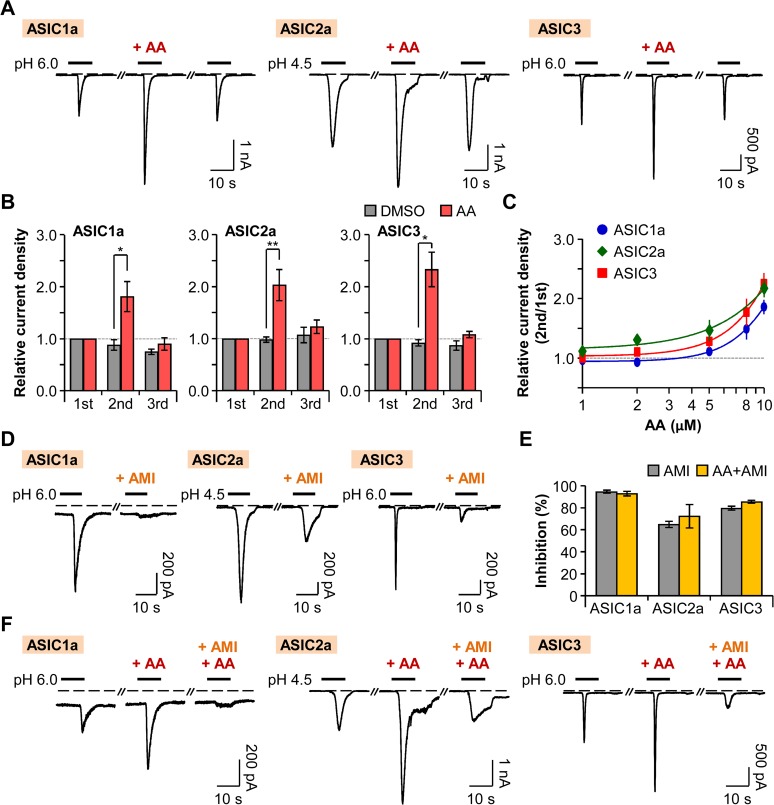
Fig 5. Potentiation of ASICs by AA.
(A) ASIC current traces activated by rapid extracellular pH changes. AA (10 μM) was bath-applied for 20 s before the second pulse. Dashed line indicates the zero current level. (B) Relative current density was measured for the cells expressing ASIC1a (n = 5 for DMSO; n = 6 for AA), ASIC2a (n = 5 for DMSO; n = 10 for AA), and ASIC3 (n = 5 for DMSO; n = 12 for AA). Current density of each pulse was divided by that of the first pulse. * P < 0.05 and ** P < 0.01, with two-way ANOVA followed by Bonferroni post-hoc test and student’s t-test. (C) Dose-dependent relative current density of ASIC1a (blue) (n = 5–20), ASIC2a (green) (n = 5–25), and ASIC3 (red) (n = 5–23). (D) ASIC1a and ASIC3 currents were inhibited by preincubation of cells with pH 7.4 solution containing amiloride (300 μM) for 20 s before the second pulse. In the case of ASIC2a, 600 μM of amiloride was applied for 30 s before and during the second pulse. (E) Percentage of inhibition by amiloride in the absence (grey) or the presence (yellow) of AA (AMI (n = 7) and AA+AMI (n = 4) for ASIC1a; AMI (n = 4) and AA+AMI (n = 3) for ASIC2a; and AMI (n = 6) and AA+AMI (n = 6) for ASIC3). (F) The potentiating effect of AA (10 μM) on ASIC currents was inhibited by amiloride. Data are mean ± SEM.

