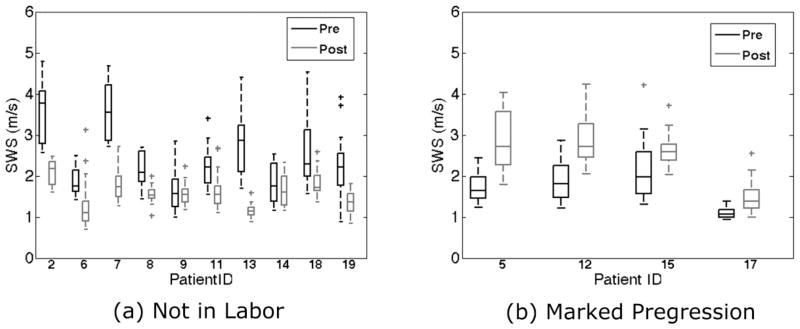
Figure 2.

Boxplot of replicate shear wave speed (SWS) estimates for each patient ID for the Not In Labor and Marked Progression groups. The boxes represent interquartile range (IQR), the interior line is the median, whiskers are maxima and minima within 1.5*IQR, and cross markers show outliers beyond the 1.5*IQR, and cross markers show outliers beyond the 1.5*IQR.
