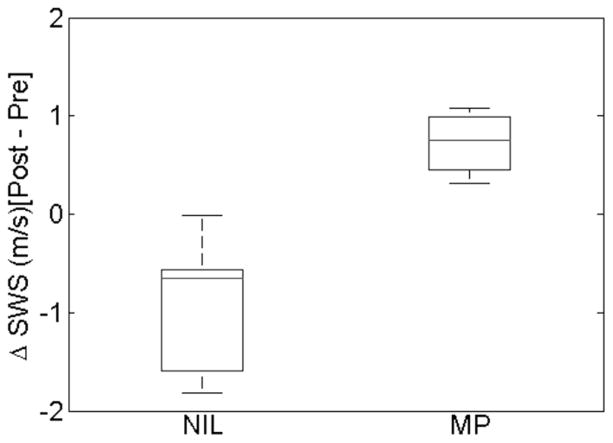
Figure 3.
Boxplot of Post-Pre SWS medians for each patient for the Not in Labor (NIL) and Marked Progression (MP) groups. For the NIL group, all SWS medians decreased for each patient indicated by values < 0 and all patients in the MP group had an increase in SWS median from pre to post measurement.

