Figure.
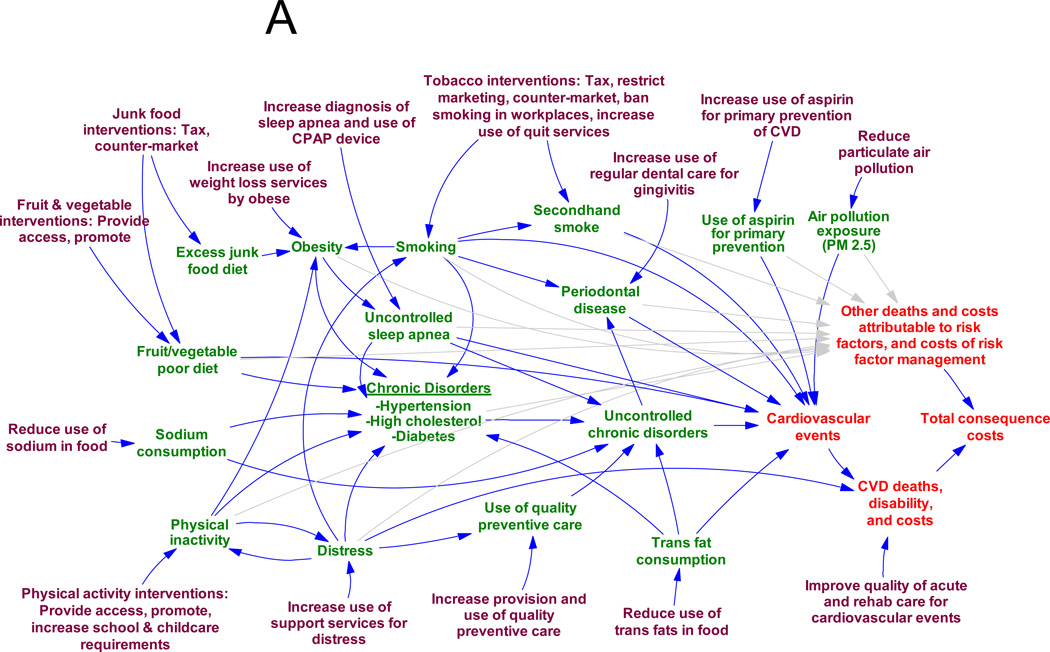
Figure A. Systems Dynamics Example
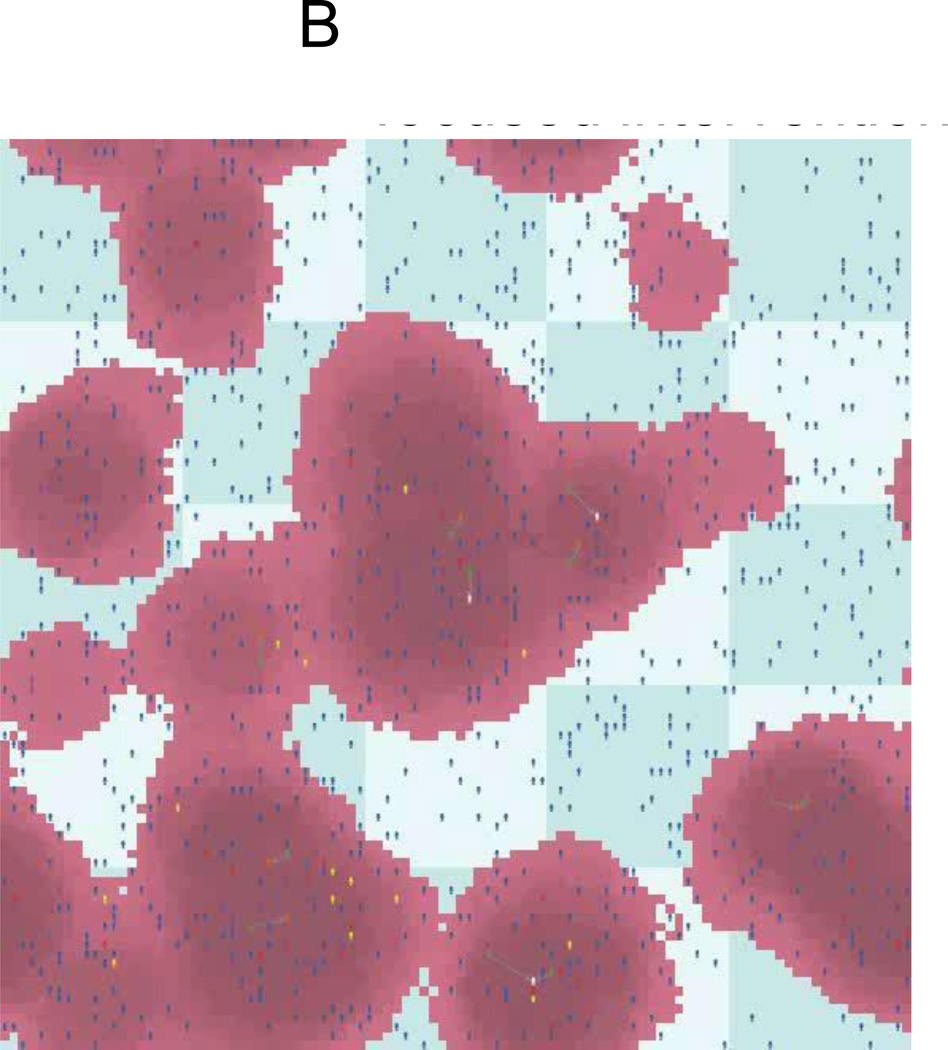
Figure B. Agent Based Model: Spatially focused intervention
Figure Description: Each agent is represented as the silhouette of a person (adults and juveniles). The colors of the agents change according to their status (e.g. juveniles committing crimes are red). When an adult becomes activated to report crimes the agents is represented as squares. The purple clouds indicate spatial areas of high crime.
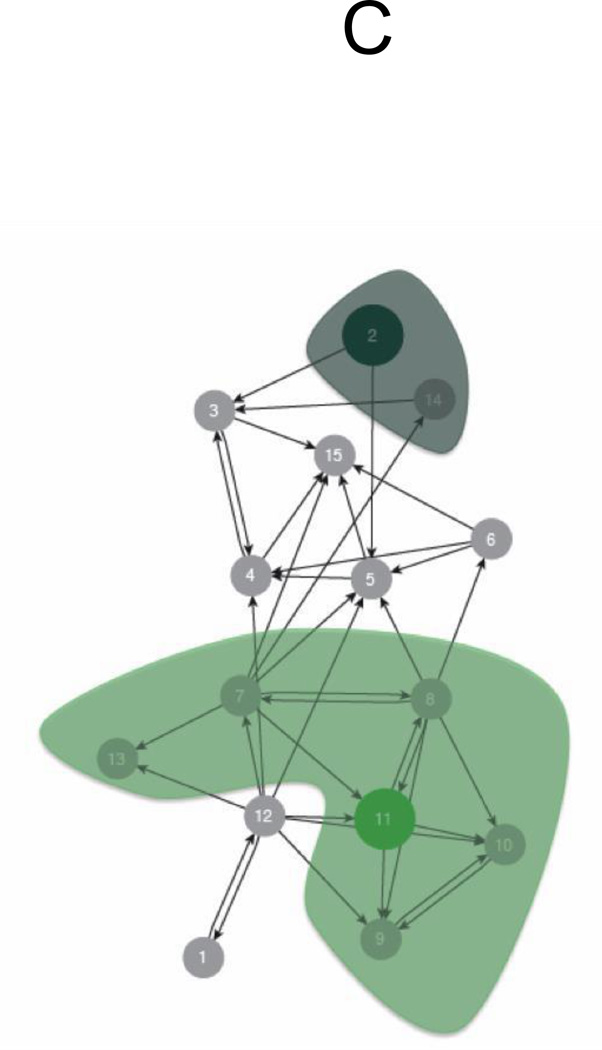
Figure C. PAS Teacher Instructional Methods Advice Network in a School
Figure Description: Each circle represents a teacher and the lines represent advice about instructional methods, with arrows pointing from advice giver to advice receiver. Here, the lead teacher selected by the principal to endorse the PAS program (#2) and her structurally similar teachers (i.e., those that share at least 1/3 of the same relationships) are shaded in dark green. An alternative teacher (#11) and her structurally similar teachers are shaded in light green. This illustrates that the lead teacher selected by the principal may not have the largest region of influence for encouraging adoption and implementation by peers.
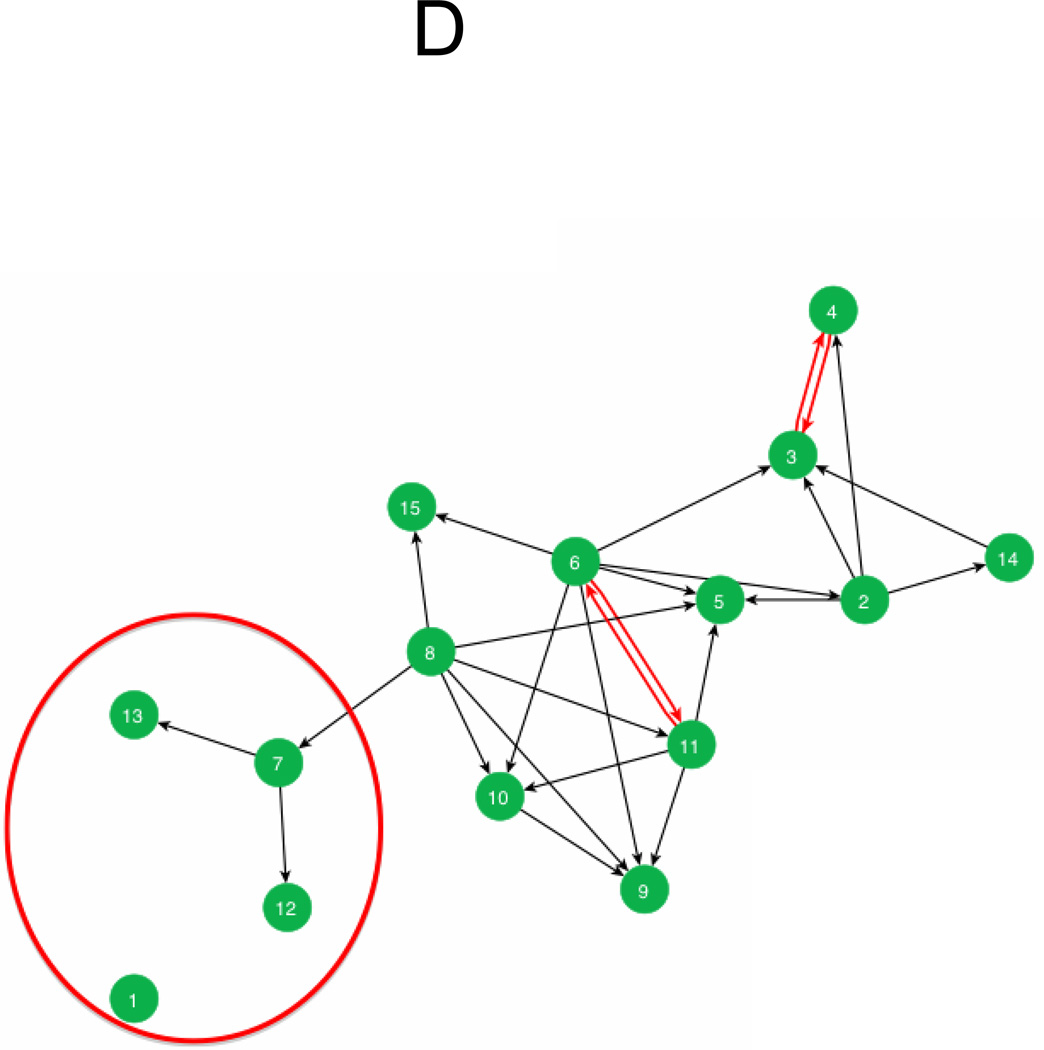
Figure D. PAS Teacher Behavior Management Advice Network in a School
Figure Description: Each circle represents a teacher and the lines represent advice about behavior management, with arrows pointing from advice giver to advice receiver. Red arrows indicate reciprocal advice relationships and the circled section of the network contains teachers with fewer advice relationships. These features of the network indicate potential barriers to reach.


