
Figure 1.
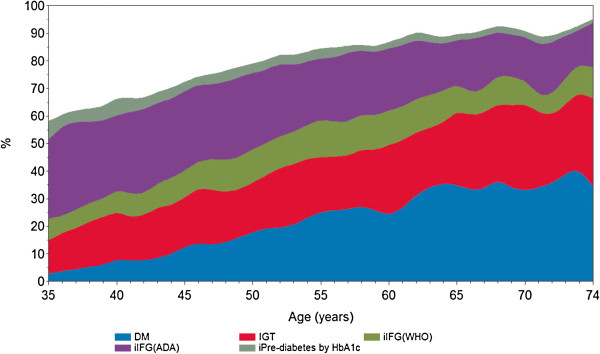
Percent of the total sample presenting a glucose abnormality by category and age. Brazilian Longitudinal Study of Adult Health (ELSA-Brasil), N = 15102, 2008-2010. Smoothing performed using a spline routine (Statistical Analysis System). DM = diabetes mellitus; IGT = impaired glucose tolerance; iIFG (WHO) = isolated impaired fasting glucose; iIFG(ADA) represents the additional cases of IFG when ascertained by the ADA criteria; iPre-diabetes by HbA1c represents the additional cases of intermediate hyperglycemia when diagnosed by ADA criteria; WHO = World Health Organization; ADA = American Diabetes Association. See Methods for diagnostic criteria.