Figure 6.

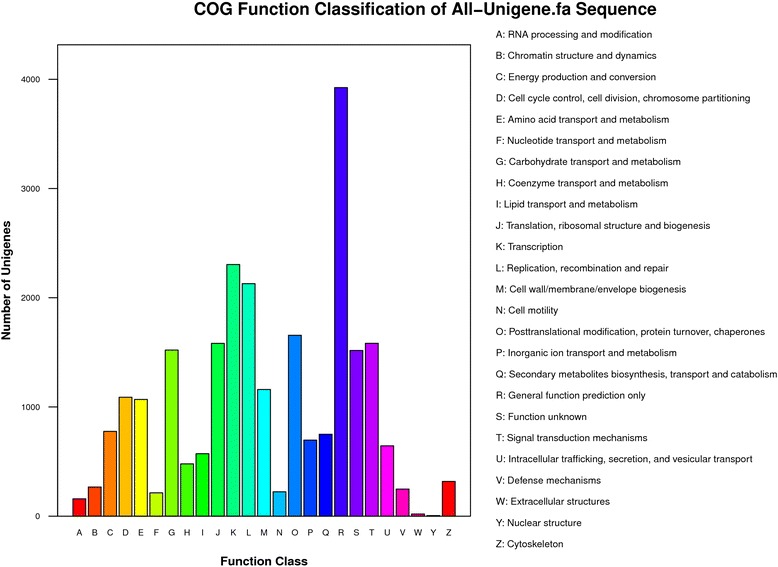
Histogram presentation of COG classification. Of 29,558 Nr hits, 11,728 sequences had COG classifications and were functionally classified into 25 categories. The y-axis indicates the number of unigenes in a specific functional category.

Histogram presentation of COG classification. Of 29,558 Nr hits, 11,728 sequences had COG classifications and were functionally classified into 25 categories. The y-axis indicates the number of unigenes in a specific functional category.