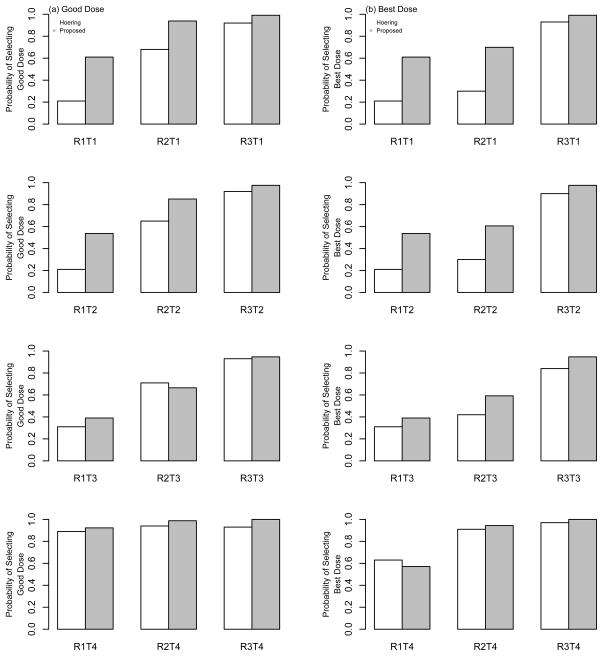
Figure 3.
Operating characteristics of the proposed design and Hoering et al. (2013). Each bar represents the proportion of times that each method recommended (a) good doses and (b) best doses as the OBD at the conclusion of a simulated Phase I/II trial with a maximum sample size of N = 64 patients.

