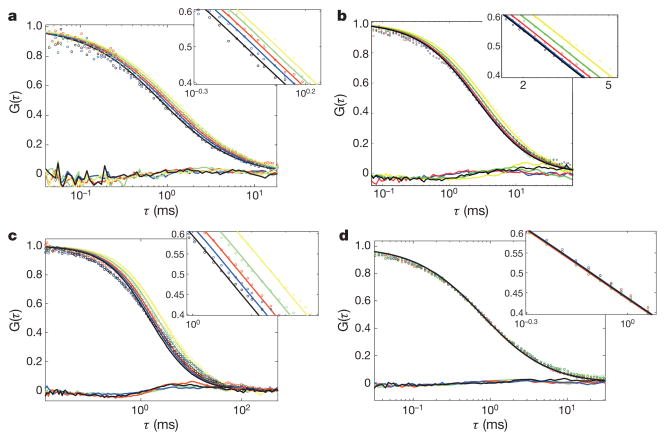
Figure 1. FCS data and residuals of the fits.
G(τ) is the normalized correlation function. Insets: zoom around the inflexion point. Lines are fits by a normal diffusion model with a single diffusive species. a, Catalase. Hydrogen peroxide concentration: yellow, 0 mM; green, 3 mM; red, 6 mM; blue, 12 mM; black, 25 mM. b, Urease. Urea concentration: yellow, 0 mM; green, 1 mM; red, 10 mM; blue, 100 mM; black, 1 M. c, Alkaline phosphatase. p-Nitrophenylphosphate concentration: yellow, 0 mM; green, 0.44 mM; red, 0.88 mM; blue, 1.74 mM; black, 2.64 mM. d, TIM. D-Glyceraldehyde 3-phosphate concentration: yellow, 0 mM; green, 0.15 mM; red, 0.31 mM; blue, 0.62 mM; black, 1.3 mM.

