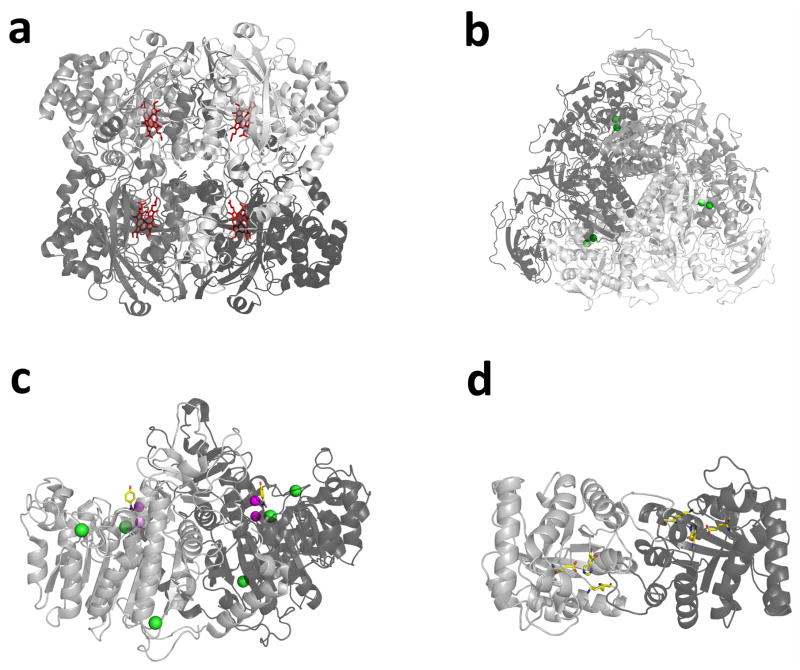
Extended Data Figure 5. Structures of the enzymes studied with active site components highlighted.
Different shades of grey indicate different monomers. a, Catalase (PDB 3NWL). Haem groups are shown as red sticks. b, Urease (PDB 4GY7). Active site nickel ions are shown as green spheres. c, Alkaline phosphatase (PDB 4KJG). Magnesium ions are shown in green; zinc ions are shown in magenta; 4-nitrophenol (hydrolysis product bound at the active site) is shown as yellow sticks. d, Triose phosphate isomerase (8TIM). Active site residues Lys 12, His 95 and Glu 165 are shown as yellow sticks.

