1. Introduction
Patient nonadherence to a doctor-prescribed therapeutic regimen is a widespread problem across all prescribed pharmaceutical treatments and is often associated with expensive and sometimes fatal consequences. It is estimated that one-half to one-third of patients practice imperfect adherence across almost all disease categories (Osterberg and Blaschke 2005). In the United States alone, it is estimated that nonadherence is responsible for as many as 125,000 preventable deaths per year (McCarthy 1998) and $290 billion in preventable health care spending per year (Cutler and Everett 2010). This makes nonadherence a major disease category on its own.
In the field of neurological diseases, patients practicing proper adherence has been linked to more positive outcomes. Improved adherence to cholinesterase inhibitors has demonstrated a marked improvement in quality-of-life for Alzheimer’s patients (Brady and Weinman 2013). Patients with Parkinson’s disease have a reduction in motor deficits when practicing proper adherence to levodopa treatments (Grosset, Antonini et al. 2009). Post-mortem toxicology has suggested that better anti-depressant adherence could reduce suicide rates (Isacsson, Bergman et al. 1994). For the treatment of epilepsy, near-perfect adherence may result in nearly two-thirds fewer pharmacoresistant patients (Modi, Rausch et al. 2014). However, the study of nonadherence has previously been limited to clinical research.
Clinical studies of nonadherence are confounded by poor patient and/or guardian reporting of adherence (Modi, Guilfoyle et al. 2011). Newer technologies, such as electronic Medication Event Monitoring System (MEMS) caps (Cramer, Mattson et al. 1989), have increased the fidelity of patient adherence data. It has is widely appreciated that patient adherence is highly irregular (Buelow and Smith 2004; Grosset, Antonini et al. 2009). However, only one clinical report thus far has demonstrated actual patient patterns of nonadherence following prescription (Modi, Rausch et al. 2011). Additionally, clinical results often group patients without regards to which pharmacotherapy they are prescribed, thus confounding the results. Finally, patient reporting may still be unreliable in these systems, as well as adequate descriptions of symptoms and adverse events (Buelow and Smith 2004; Hoppe, Poepel et al. 2007). This, in turn, increases the error when attempting to correlate nonadherence to specific disease state outcomes; e.g., efficacy and adverse events (Faught 2012). A novel system that can directly measure the impact of nonadherence in an etiologically relevant animal disease model would begin to address these concerns.
Simulating daily patterns of nonadherence is possible without use of an automated system. However, it would require a substantial commitment of resources (i.e., 24 hours a day, 7 days a week), in order to deliver drugs on a fixed schedule; thus, it is not feasible for a long-term chronic experiment. To make the study of nonadherence feasible requires an automated system that can reliably deliver a fixed dose of drug for a protracted period of time. One method to deliver drugs to animals is through the use of food pellets that are formulated with a specific quantity of a given drug (Grabenstatter, Clark et al. 2007). Thus, adherence can be simulated by administering medicated pellets for a single meal to simulate “taking” a dose, and administering unmedicated placebo control food pellets to simulate “missing” a dose.
Having the drug-in-food pellets available still requires a means to deliver them to the animal at a schedule that meets the needs of the individual investigator. This need led to the design and creation of the system described herein; i.e., an automated pellet delivery system capable of delivering medicated or unmedicated food pellets 24/7 according to an experimenter defined feeding schedule. The proof-of-principle experiments that were conducted to demonstrate the feasibility of the approach employed epileptic rats housed individually in a cage that was equipped with two feeders, thereby allowing each animal to have independent levels of experimenter-defined nonadherence. The methods describe the design and implementation of this system. While the system is integrated with video-EEG so that the delivery and consumption of anti-seizure drugs could be correlated with seizure control, the implementation of this system without video-EEG would certainly permit the study of nonadherence in a variety of animal disease models. Moreover, it would also allow for chronic delivery of drug for the purpose of conducting pharmacokinetic/pharmacodynamic studies.
2. Methods
2.1 System Architecture Overview
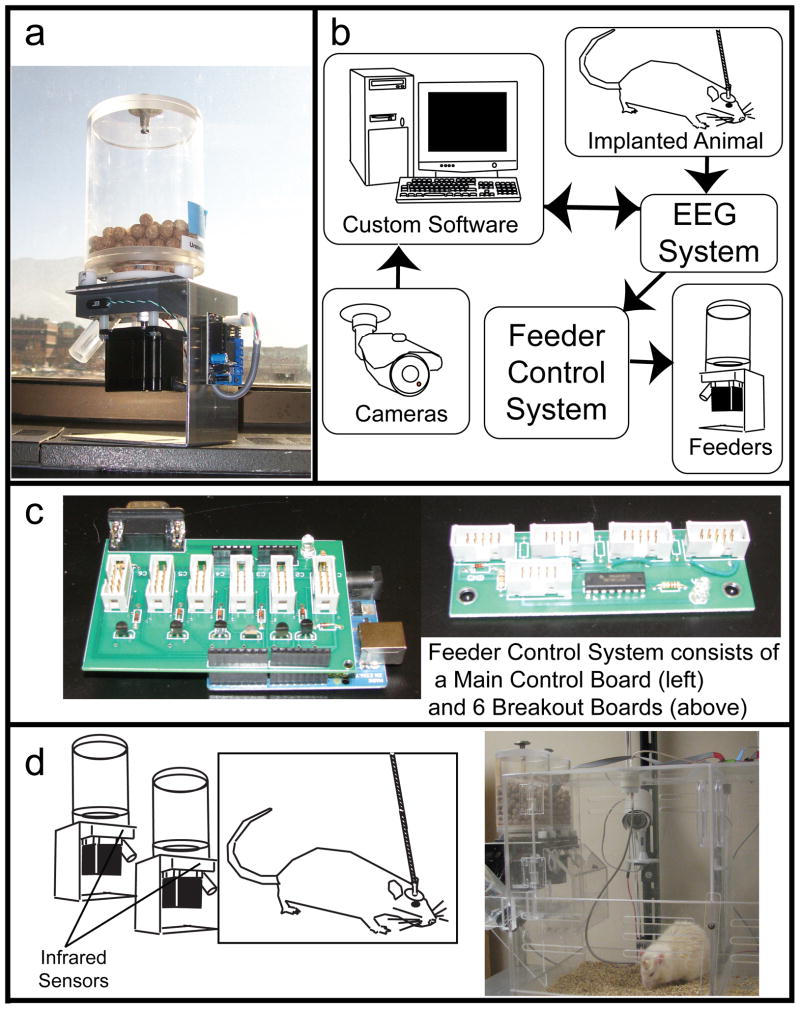
The system is able to administer medicated and non-medicated pellets to up to twelve individual epileptic rats in an effort to simulate clinically relevant patterns of nonadherence (Modi, Rausch et al. 2011). Additionally, the system coordinates the recording of EEG and video so that the resulting impact of nonadherence in an animal model of epilepsy can be assessed. The overall system design contains 24 automated feeders (Fig 1A), a Feeder Control System, a BioPac MP150 EEG recording system, and a computer running custom videoEEG software (Fig. 1B). The feeder control system consists of 6 breakout boards and a main control board (Fig. 1C). The breakout board is a custom printed circuit board (PCB) that controls up to four feeders. The main control board consists of an open-source Arduino Uno microcontroller and a custom PCB that works as an Arduino shield, i.e. an expansion PCB which is designed to fit into the standardized Arduino pin-headers. Custom PCBs were designed using the freely available ExpressPCB software, and fabricated by ExpressPCB (www.expresspcb.com). PCB designs are included in the supplementary materials.
Figure 1.
Overall System Design. (a) A single modified feeder. (b) System schematic. (c) Populated PCBs that make up the Feeder Control System. (d) Schematic and photo of single, dual feeder cage block.
The system works by generating commands in the custom software and using the feeder control system to distribute the commands to the individual feeders. The methods that follow describe how commands are executed, starting at the software, and ending with the confirmation that a pellet was delivered.
2.2 Simulating Nonadherence via Daily Feedings
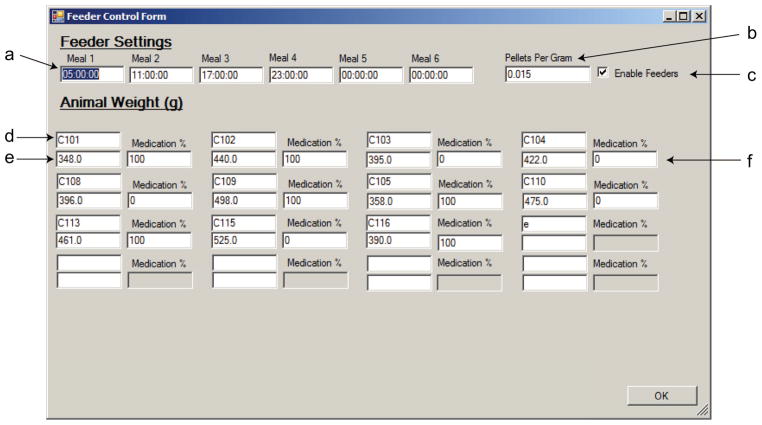
Because patient nonadherence is dynamic (Glass, Battegay et al. 2010)), the simulation of nonadherence requires the ability to simulate randomized patterns of either “missed” and “taken” doses. For the purpose of this study, nonadherence is simulated by giving each animal a randomized pattern of medicated and unmedicated feedings. To perform this randomization, the determination of whether the animal receives a medicated or unmedicated meal is based on a set integer percentage specified by the user. In the case of a fractional number of meals, the number of medicated meals is rounded up. At the beginning of a new week (Sunday night), or when the medication % value is entered in for a new animal, the software creates an array for all the remaining meals in the week. Then, values are sequentially removed from the array, until the medication % has been reached. This way, the percentage of meals that are medicated is fixed, while the actual patterns of nonadherence are randomized in an independent manner. This system also provides the ability to manually change the rate of adherence so that different levels of nonadherence can be administered to a single animal over the course of a treatment paradigm. Figure 2 shows how all of the options are defined by the software. Up to six feedings can be delivered per day in our current configuration and any meal can be disabled by entering a time of 0:00:00. Thus, no meals can occur at midnight. Increasing the number of daily feedings beyond six would require only trivial changes to the C# code. Additionally, more complex patterns of nonadherence could also be coded into the software package.
Figure 2.
Feeder control form. This screenshot shows the system control form containing all the information needed to control daily feedings. (a) Feedings, up to 6 per day, are controlled by defining the time (military time), at which the feedings should be executed. A time of 0:00:00 disables that meal. (b) The investigator defines the ratio of pellets to body weight (in grams) per meal. (c) This box enables/disables scheduled feedings. (d) Animal ID#. This is recorded in the software, which allows for unique identification of the animals. Locations match the setup of the room, as illustrated in figure 2c. (e) Animal weight, used to calculate how many pellets are given per meal, in conjunction with (b). (f) Medication %, which determines what percentage of all meals are medicated per week.
2.3 Command Creation and Execution
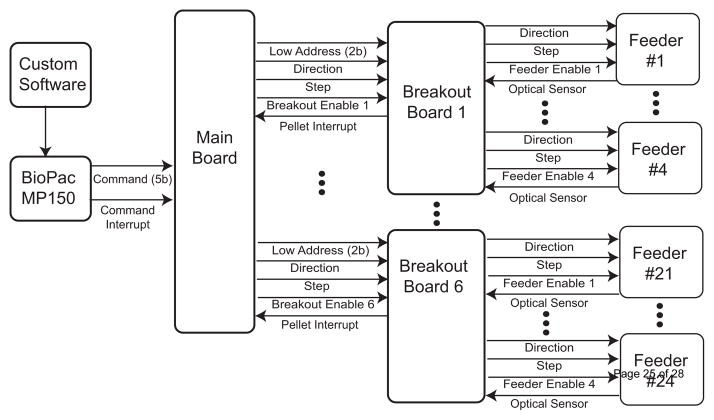
The flow of commands is shown in Figure 3. The custom software, written in Visual C# (Microsoft, Redmond WA), synchronizes the recording of the BioPac MP150 EEG recording system (BioPac Systems Inc., Goleta, CA) with video recordings streamed from EZWatch Pro Security Cameras (EZWatch, Louisville, KY) and captured by a DVP7020BE MPEG4 Video card (Advantech, Milpitas, CA) and the delivery of non-medicated and medicated food pellets. A C# software timer checks if the current time matches the time required for a feeding, and creates the commands based on the procedure described in 2.2. When the user-specified time arrives, the software enqueues all of the commands by calculating the number of pellets required for a feeding based on the weight of each animal.
Figure 3.
Layout of the data flow for feeding control. This setup allows for 24 feeders to be independently controlled with 6 breakout boards, and one main board.
2.3.1 Command Cycles
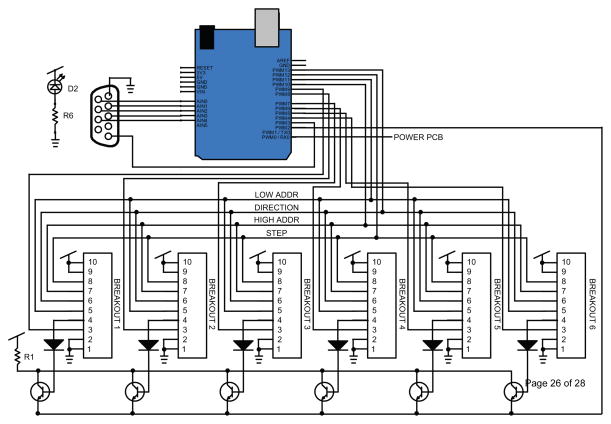
To continuously stream EEG data, the software sends a request to the MP150 for 250ms of EEG data from 1 to 16 channels of EEG recording. At the receipt of this data request, the software writes the newly-acquired data to disk and checks for any commands that need to be sent to the feeding system. The MP150 sends these commands as an unsigned 5-bit parallel output. An additional single digital output serves as a strobe to signal that a new command is present on the digital output lines. The software sends a single feeding command per data request cycle. The strobe bit from the MP150 is connected to an interrupt pin on the main control board. The schematic for the main board is included in Figure 4.
Figure 4.
Schematic of the main system control board.
2.3.2 Command Communication
Each unsigned 5-bit command consists of either a feeder address, pellet count, or an execute command. To execute a single animal’s feeding, the feeding software must sequentially send a feeder address (0 to 23, i.e. 0b00000 to 0b10111) followed by a pellet count (1 to 30, i.e. 0b00001 to 0b11110). If more than 30 pellets are required for a feeding, the software will split the feeding into multiple sets of feeder address and pellet count commands. Once all the commands for all the animals have been sent, an execute command (0b11111) is given to inform the feeder system that all commands are delivered. This command tells the Arduino to begin execution of a feeding. The pinout connection for the BioPac MP150/Main board connection are listed in Table 1.
Table 1.
Pinout of the cable that connects the BioPac MP150 to the Feeding System
| Pin Name | BioPac MP150 DB25 |
Feeder Main Control Board DB9 |
|---|---|---|
| GND | 5 | 1 |
| Strobe | 17 | 5 |
| C0 | 1 | 6 |
| C1 | 2 | 2 |
| C2 | 3 | 7 |
| C3 | 4 | 3 |
| C4 | 14 | 8 |
2.3.3 Command Execution
At the occurrence of a low-to-high transition on the strobe line, the main control board will read the state of the digital pins connected to the digital port connected to the MP150. These commands are placed into two buffers, one for feeder address, and a second for pellet count. At the presence of an execute command, these buffers will be read and executed in a first-in-last-out (FILO) order. The feeder address is translated into hardware by separating the lower two bits from the upper three bits. The lower two bits are sent to each breakout board, while the upper three bits are translated in software to determine which of the six breakout boards to enable. The Arduino code is included in the supplementary files.
2.4 Feeder Operation
The feeder is attached to the breakout board via a 10-pin ribbon cable, which is separated into a 6-pin header, and a custom 4-pin connection to the infrared diode/phototransistor pair (Table 2). Each feeder receives three inputs; Step, Direction, and Enable. The Step and Direction pins are concurrently sent to all 24 feeders connected in the system. However, only the feeder which has its enable line set low responds to the step and direction command. The mechanical design of the feeder uses a modified version of a design from a commercially purchased automated pellet dispenser (ENV-203-1000, www.med-associates.com, St. Albans, VT) commonly used for behavioral experiments. This dispenser uses a stepper motor (STP-MTR-23055, www.automationdirect.com, Cumming, GA) to turn a rotary rod, which allows for single 1-gram pellets to be dispensed. The motor is controlled using a “Stepper Motor Driver v3.3” board (www.thingiverse.com/thing:4970/#instructions), an open-source circuit design for stepper motor control. This board allows for TTL level voltages to be used to drive the higher voltage input required to run the stepper motor. To drive pellet delivery, the step pin is driven high for 40ms, then driven low for 40ms, making each step 80ms long. This cycle repeats until the delivery of all pellets has been confirmed.
Table 2.
Pinouts of the ribbon cables connecting the main board to the breakout board, and the breakout board to the feeders.
| Function: | ||
|---|---|---|
| Pin Number | Main Control <-> Breakout | Breakout <-> Feeder |
| 1 | GND | GND |
| 2 | GND | GND |
| 3 | ENABLE | STEP |
| 4 | PELLET DETECT | DIR |
| 5 | FEEDER LOW | ENABLE |
| 6 | DIRECTION | N/C |
| 7 | FEEDER HIGH | COLLECTOR |
| 8 | STEP | EMITTER |
| 9 | VDD | ANODE |
| 10 | VDD | CATHODE |
2.4.1 Feeder Control
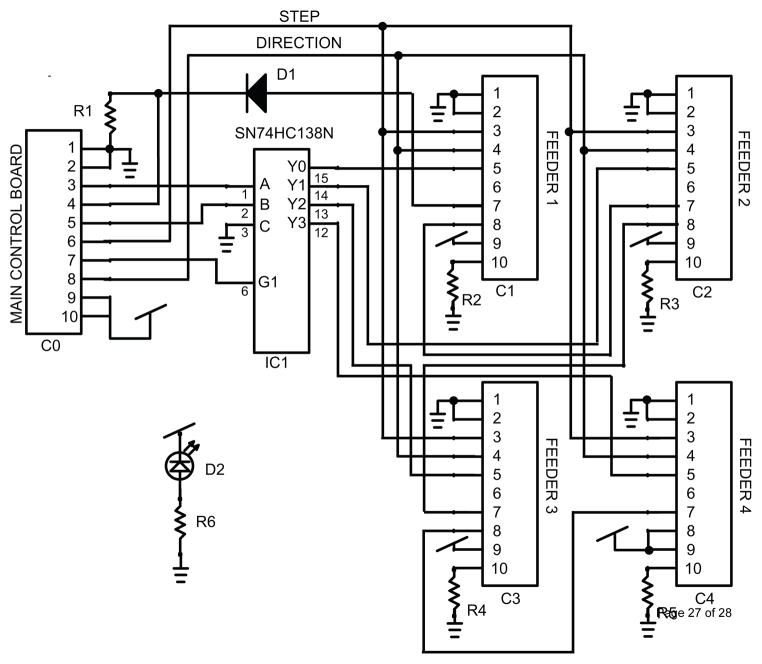
An individual feeder can be controlled by individual activation of the enable input on the stepper motor driver controller. The step command is concurrently sent to all feeders, but it is ignored by the feeder so long as the driver’s enable line is set to disabled. Each breakout board receives the same lower two bits of the feeder address, i.e. 0b00 to 0b11. Each address is translated on the breakout board using a SN74HC138N 3-to-8 line decoder (Texas Instruments, www.ti.com). The output from this chip is fed into each enable input for the four attached feeders. The decoder has a separate enable, which is sent from the main control board. Thus, one is able to use the same 4 low bit address lines, coupled with 6 individual enable lines for the decoders, to independently control all 24 feeders. An outcome of this design is that only one feeder may be active at a time. The schematic for the breakout board is included in Figure 5.
Figure 5.
Schematic of the breakout board.
2.5 Pellet Detection via Infrared Sensor
Positive delivery of a pellet is measured via an infrared (IR) sensor/receiver pair positioned across a 1/16″ hole in the feeding tube. Pellet detection is done for each feeder individually using an OPB 100 IR LED and a phototransistor pair (OPTEK TT Electronics). Each pair of transmitter and receiver is mounted perpendicular to the feeding tube and the phototransistor is normally in the active state. However, when a pellet crosses in front of the LED, the light is blocked, putting the phototransistor in the cut-off state. This transition is long enough to trigger a software interrupt on the Arduino Uno. The data path of this interrupt can be traced in Figure 6. Following the interrupt, four step cycles must occur before the next pellet is counted. This serves as a debounce function to prevent a single pellet from being counted more than once.
Figure 6.
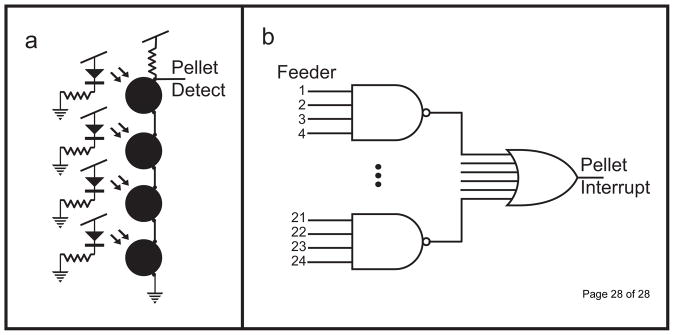
Schematic and logic setup for infrared pellet detection system for the breakout boards and main board. (a) Schematic diagram showing the layout of four feeders’ infrared sensors attached to a single breakout board. While no sensor is blocked, the signal is pulled low. When a pellet crosses in front of the LED, the pull-up resistor drives the signal high. This layout creates a NAND gate. (b) The NAND structures from each of 6 breakout boards are fed into a BJT OR gate on the main board.
The IR sensor pair on each block of four feeders shares a single output line leaving the breakout board. To allow all four IR feeders to share the same line, the phototransistors are tied together in serial, creating a NAND logic structure. In other words, while all 4 transmitters are active, the output line is high. If any transistor is off (i.e. a pellet crosses in front of the beam), the signal is pulled low. This allows for a single output to monitor the activity of all four feeders (Fig. 6A). For successful operation of the feeder system, all 4 feeders must be attached to a breakout board, or else the sensor logic will be incomplete, rendering pellet detection impossible. The ‘pellet detect’ from each breakout board is fed into an OR gate on the main board (Fig. 6B) Thus, a single interrupt pin on the Arduino monitors the state of all feeders currently attached to the system. During pellet delivery, if 125 step cycles occur without the delivery of a pellet, the direction bit is flipped, reversing the direction of rotation, and the feeding continues. Preliminary tests have shown this is sufficient to release jammed feeders during pellet delivery.
2.6 Powering the Feeders
The stepper motors require a higher voltage than TTL-level voltage to run. To conserve on power and reduce 60Hz noise, the stepper motor drivers are only supplied 28V power during the execution of a feeding. A separate power PCB was created to control this voltage switching. A power transistor, wired to pin 0 of the Arduino, is driven high at the start of the feeding. A PCB for this power output is included in the supplementary material.
2.7 Availability of Software and Designs
All PCBs and software code are open source, and thus are included or freely available on the internet at (https://code.google.com/p/biopacvideo/). Two exceptions exist. The mechanical design of the feeder is based on a commercial design and, as such, will require purchase to implement the project. Additionally, the software that controls the BioPac MP150 is closed source. Thus, communication with the BioPac MP150 requires the developer dynamic link library, which is available for purchase from BioPac.
3. Results and Discussion
The result of this work is the design of a flexible system that provides the ability to chronically administer medicated and unmedicated food to 12 animals 24 hours a day, seven 7 days a week, with minimal investment of staff labor and an elimination of the handling-induced stress associated with chronic manual delivery of a drug. The system described herein allows for a large variety of chronic studies to be performed in different disease models.
3.1 Preliminary Experimentation
A validation study was conducted using the system described herein where rats with epilepsy were dosed with the ASD carbamazepine at different levels of adherence; i.e., 0%, 50%, and 100%. During the course of this study, feeder operation was confirmed daily. Feeding system faults, such as jammed feeders, empty feeders, or electronic faults would result in the system attempting to run the faulty feeder continuously. However, the most common fault came from custom software exceptions resulting from power outages or insufficient disk space. Over the course of this study, 16,988 meals were intended, of which, 16,837 were delivered as instructed (99.1%). The results generated from this study are extensive, and beyond the scope of this manuscript.
3.2 System Improvements
A consequence of the combination of infrared monitoring is that any malfunction of a single feeder’s phototransistor or its connections will cause a failure in the ability to measure all feeders’ pellet distribution. Additionally, all four feeders must be connected to a breakout board for the system to be able to record the distribution of pellets. Future iterations of the described system will individually read from each set of feeders based on which breakout board is currently enabled. Also, the feeder system does not skip a permanently jammed or empty feeder. A method in which a feeder could be skipped in the queue, and then returned to at the end, would allow all other animals to be fed, regardless of feeder faults. This would require additional circuitry to isolate the IR sensors on each breakout board. Additionally, bi-direction communication would increase the fidelity of the system. As it is currently written, errors in the feeding system are not reported or recorded by the system’s software. The quality of data would increase if the experimenter were able to access additional data including the proper completion of a feeding, how long each feeding took, and/or if any errors occurred during the feeding. Two additional inputs are available on the Arduino and could be utilized for this feedback.
3.3 Other applications
The current version of this setup relies on the Biopac MP150 to communicate the daily feeding via software control. Other projects may use a different method of supplying the feeding commands, since the MP150 is prohibitively expensive for applications that do not require EEG. This could be achieved without the use of an external source supplying feeding commands; however, an external real-time clock, as well as a reprogrammable source that contains the daily feeding parameters, such as a flash ROM or an SD card, would be required.
While the system was designed with the study of consequences of nonadherence in the treatment of epilepsy, it could be widely applicable to other neurological disease states. For example, in the study of depression, animals could be evaluated using a forced-swim or tail-suspension test (Cryan, Mombereau et al. 2005; Petit-Demouliere, Chenu et al. 2005), to determine the effectiveness of anti-depressants under the conditions of nonadherence. In the study of Alzheimer’s disease, APP23 transgenic mouse models treated chronically with acetylcholinesterase inhibitors have been shown to have improved performance in the Morris water maze (Van Dam, Coen et al. 2008). Whether or not these disease modifying effects occur under the conditions of imperfect adherence is of significant clinical importance. Additionally, the previously mentioned tests could be used to evaluate the effectiveness of novel investigational compounds under conditions of nonadherence. For example, a potential new therapy may perform comparably to currently-available treatments when tested under the assumption of perfect adherence. However, a new compound which is more effective under conditions of imperfect adherence could have substantial impact on the treatment of the relevant disease. A pre-clinical model built to screen novel compounds under imperfect adherence would elucidate these differences.
3.4 Limitations
A potential limitation of the described automated feeding system is that it relies on animal consumption of delivered food. This means there are two additional requirements to the system: the pellets used must be palatable, and the animals must be fed on a schedule and rate which does not satiate their appetite; i.e., they remain sufficiently hungry so that all pellets are consumed. However, this method of dosing is beneficial due to the reduced stress induced in the animal. In the initial experiment outlined above, pellet consumption was tracked during a weekly cage cleaning, and any unconsumed pellets were counted and recorded. Results from the preliminary experiments conducted, suggest that over the course of a week, animals dosed at a level of 50% adherence consumed all pellets administered greater than 50% of the time. This suggests that animals consumed the majority of food and thus drug administered. When pellets remained, animals consumed approximately 91% of all pellets administered; i.e., a median of 2.6 meals (out of 28 delivered) remained at the end of the week. It is important to note that the pellets not consumed reflects a reduction in total pellet consumption over the week, rather than a complete skip of specific meals and therefore doses. Importantly, the system as described does provide a novel approach to the chronic oral delivery of medication without the stress associated with repeated oral gavage, injections, or other invasive methods of chronic dosing.
Additionally, the system is currently limited to one fixed percentage of nonadherence per animal at any given time point, without human intervention. While clinical observations have shown that nonadherence follows a more dynamic time course (Modi, Rausch et al. 2011), the fixed percentage of nonadherence was chosen for a first-pass validation of the system. Thus, direct implementation of the system from these methods and software provided would limit experimenters to a fixed level of nonadherence for each animal. However, it only requires trivial changes to the software to modify how the software determines whether the next meal to deliver is medicated or unmedicated, and could be adapted to any variety of different conditions, as needed by the investigator.
4. Conclusion
This system is the first of its kind and was designed to optimize preclinical adherence models for more relevant translation for bench-to-bedside research. The automated drug-in-pellet delivery system described herein permits the delivery of drugs according to a feeding schedule based on the individual pharmacokinetics of a given drug; i.e. the rate of metabolism and elimination of the drug. Any pharmaceutical intervention that can be integrated into food pellets, and is sufficiently palatable to the animal employed in the study, could be used in this model. Thus, the system described herein provides the opportunity to ask pressing questions about the effects of nonadherence or long-term efficacy on chronic diseases in animal models.
Supplementary Material
Highlights.
Novel model of nonadherence which uses drug-in-food to treat animals chronically
Future studies will examine the consequences of nonadherence in epileptic rats
Utility extends to nonadherence in any etiologically-relevant animal disease model
Open-source method allows for implementation of a system for modeling nonadherence
Footnotes
Publisher's Disclaimer: This is a PDF file of an unedited manuscript that has been accepted for publication. As a service to our customers we are providing this early version of the manuscript. The manuscript will undergo copyediting, typesetting, and review of the resulting proof before it is published in its final citable form. Please note that during the production process errors may be discovered which could affect the content, and all legal disclaimers that apply to the journal pertain.
References
- Brady R, Weinman J. Adherence to cholinesterase inhibitors in Alzheimer’s disease: a review. Dement Geriatr Cogn Disord. 2013;35(5–6):351–363. doi: 10.1159/000347140. [DOI] [PubMed] [Google Scholar]
- Buelow JM, Smith MC. Medication management by the person with epilepsy: perception versus reality. Epilepsy Behav. 2004;5(3):401–406. doi: 10.1016/j.yebeh.2004.02.002. [DOI] [PubMed] [Google Scholar]
- Cramer JA, Mattson RH, et al. How often is medication taken as prescribed? A novel assessment technique. JAMA. 1989;261(22):3273–3277. [PubMed] [Google Scholar]
- Cryan JF, Mombereau C, et al. The tail suspension test as a model for assessing antidepressant activity: review of pharmacological and genetic studies in mice. Neurosci Biobehav Rev. 2005;29(4–5):571–625. doi: 10.1016/j.neubiorev.2005.03.009. [DOI] [PubMed] [Google Scholar]
- Cutler DM, Everett W. Thinking outside the pillbox--medication adherence as a priority for health care reform. N Engl J Med. 2010;362(17):1553–1555. doi: 10.1056/NEJMp1002305. [DOI] [PubMed] [Google Scholar]
- Faught E. Adherence to antiepilepsy drug therapy. Epilepsy Behav. 2012;25(3):297–302. doi: 10.1016/j.yebeh.2012.08.027. [DOI] [PubMed] [Google Scholar]
- Glass TR, Battegay M, et al. Longitudinal analysis of patterns and predictors of changes in self-reported adherence to antiretroviral therapy: Swiss HIV Cohort Study. J Acquir Immune Defic Syndr. 2010;54(2):197–203. doi: 10.1097/QAI.0b013e3181ca48bf. [DOI] [PubMed] [Google Scholar]
- Grabenstatter HL, Clark S, et al. Anticonvulsant effects of carbamazepine on spontaneous seizures in rats with kainate-induced epilepsy: comparison of intraperitoneal injections with drug-in-food protocols. Epilepsia. 2007;48(12):2287–2295. doi: 10.1111/j.1528-1167.2007.01263.x. [DOI] [PubMed] [Google Scholar]
- Grosset D, Antonini A, et al. Adherence to antiparkinson medication in a multicenter European study. Mov Disord. 2009;24(6):826–832. doi: 10.1002/mds.22112. [DOI] [PubMed] [Google Scholar]
- Hoppe C, Poepel A, et al. Epilepsy: accuracy of patient seizure counts. Arch Neurol. 2007;64(11):1595–1599. doi: 10.1001/archneur.64.11.1595. [DOI] [PubMed] [Google Scholar]
- Isacsson G, Bergman U, et al. Antidepressants, depression and suicide: an analysis of the San Diego study. J Affect Disord. 1994;32(4):277–286. doi: 10.1016/0165-0327(94)90092-2. [DOI] [PubMed] [Google Scholar]
- McCarthy R. The price you pay for the drug not taken. Bus Health. 1998;16(10):27–28. 30, 32–23. [PubMed] [Google Scholar]
- Modi AC, Guilfoyle SM, et al. Development and reliability of a correction factor for parent-reported adherence to pediatric antiepileptic drug therapy. Epilepsia. 2011;52(2):370–376. doi: 10.1111/j.1528-1167.2010.02789.x. [DOI] [PMC free article] [PubMed] [Google Scholar]
- Modi AC, Rausch JR, et al. Patterns of nonadherence to antiepileptic drug therapy in children with newly diagnosed epilepsy. JAMA. 2011;305(16):1669–1676. doi: 10.1001/jama.2011.506. [DOI] [PMC free article] [PubMed] [Google Scholar]
- Modi AC, Rausch JR, et al. Early pediatric antiepileptic drug nonadherence is related to lower long-term seizure freedom. Neurology. 2014;82(8):671–673. doi: 10.1212/WNL.0000000000000147. [DOI] [PMC free article] [PubMed] [Google Scholar]
- Osterberg L, Blaschke T. Adherence to medication. N Engl J Med. 2005;353(5):487–497. doi: 10.1056/NEJMra050100. [DOI] [PubMed] [Google Scholar]
- Petit-Demouliere B, Chenu F, et al. Forced swimming test in mice: a review of antidepressant activity. Psychopharmacology (Berl) 2005;177(3):245–255. doi: 10.1007/s00213-004-2048-7. [DOI] [PubMed] [Google Scholar]
- Van Dam D, Coen K, et al. Cognitive evaluation of disease-modifying efficacy of donepezil in the APP23 mouse model for Alzheimer’s disease. Psychopharmacology (Berl) 2008;197(1):37–43. doi: 10.1007/s00213-007-1010-x. [DOI] [PubMed] [Google Scholar]
Associated Data
This section collects any data citations, data availability statements, or supplementary materials included in this article.


