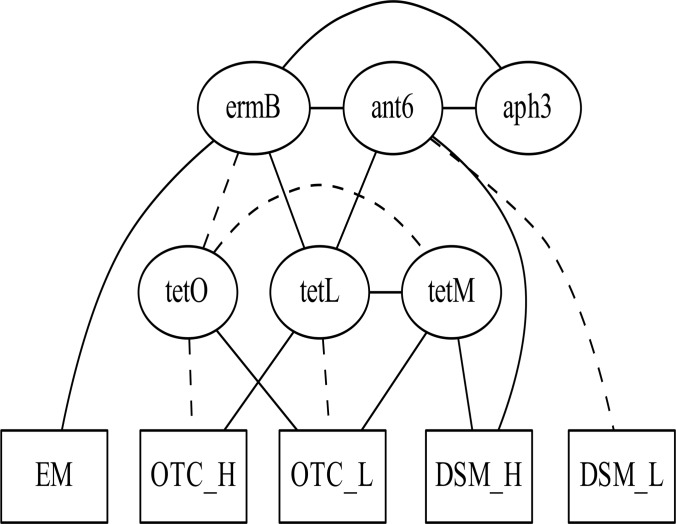
Fig 2. Initial optimal additive Bayesian network model.
Identified interrelationships between selected antimicrobial resistance genes and their effects on the phenotypic expressions of resistance among 113 isolates of Enterococcus faecalis from domestic poultry products collected from retail shops in 5 major Japanese cities between July and August 2012. Abbreviations: ant6: ant(6)-Ia; aph3: aph(3’)-IIIa; EM: erythromycin resistance; DSM_L: MIC for dihydrostreptomycin ≥128 μg/mL and ≤512 μg/mL; DSM_H: MIC for dihydrostreptomycin >512 μg/mL; OTC_L: MIC for oxytetracycline ≥16 μg/mL and ≤64 μg/mL; OTC_H: MIC for oxytetracycline >64 μg/mL. Solid lines and dashed lines represent positive and negative associations between variables, respectively.

