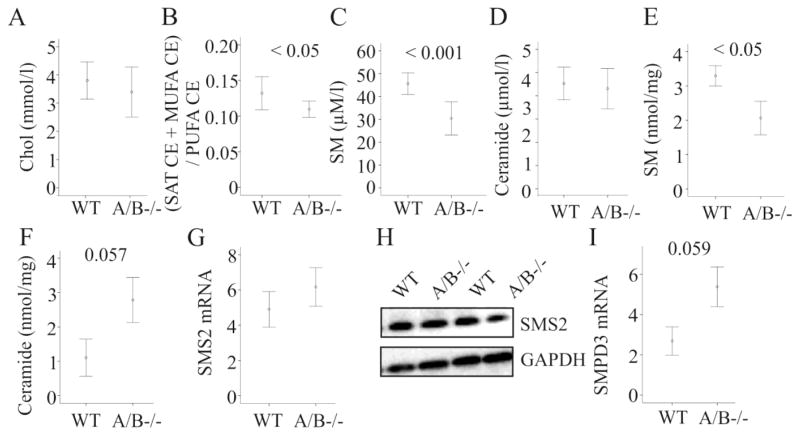
Figure 7. Cholesterol, sphingomyelin and ceramide in SNTA/B2−/− (A/B−/−) mice fed a HFD.
(A) Serum cholesterol measured in 8 WT and 8 SNTA/B2−/− mice fed a HFD for 25 weeks by ESI-MS/MS. (B) Ratio of saturated (SAT) and monounsaturated (MUFA) to polyunsaturated (PUFA) cholesteryl ester (CE) species in the serum of these mice. (C) Serum sphingomyelin (SM) measured in 8 WT and 8 SNTA/B2−/− mice fed a HFD for 25 weeks. (D) Serum ceramide measured in 8 WT and 8 SNTA/B2−/− mice fed a HFD for 25 weeks. (E) Hepatic sphingomyelin (SM) measured in 4 WT and 4 SNTA/B2−/− mice fed a HFD for 25 weeks. (F) Hepatic ceramide measured in 4 WT and 4 SNTA/B2−/− mice fed a HFD for 25 weeks. (G) SMS2 mRNA in the liver of 8 wild type and 7 SNTA/B2 null mice. (H) SMS2 protein in the liver of two wild type and two SNTA/B2 null mice. (I) SMPD3 mRNA in the liver of 8 wild type and 6 SNTA/B2 null mice.

