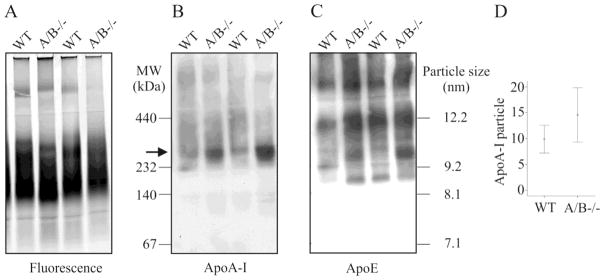
Figure 8. Distribution of lipoproteins.

(A) Plasma samples stained with a lipophilic dialkylaminostyryl fluorophore. (B) Plasma samples were analyzed for distribution of ApoA-I and (C) ApoE. (D) Quantification of the ApoA-I particles marked by an arrow in B in plasma of 6 wild type and 7 SNTA/B2−/− animals.
