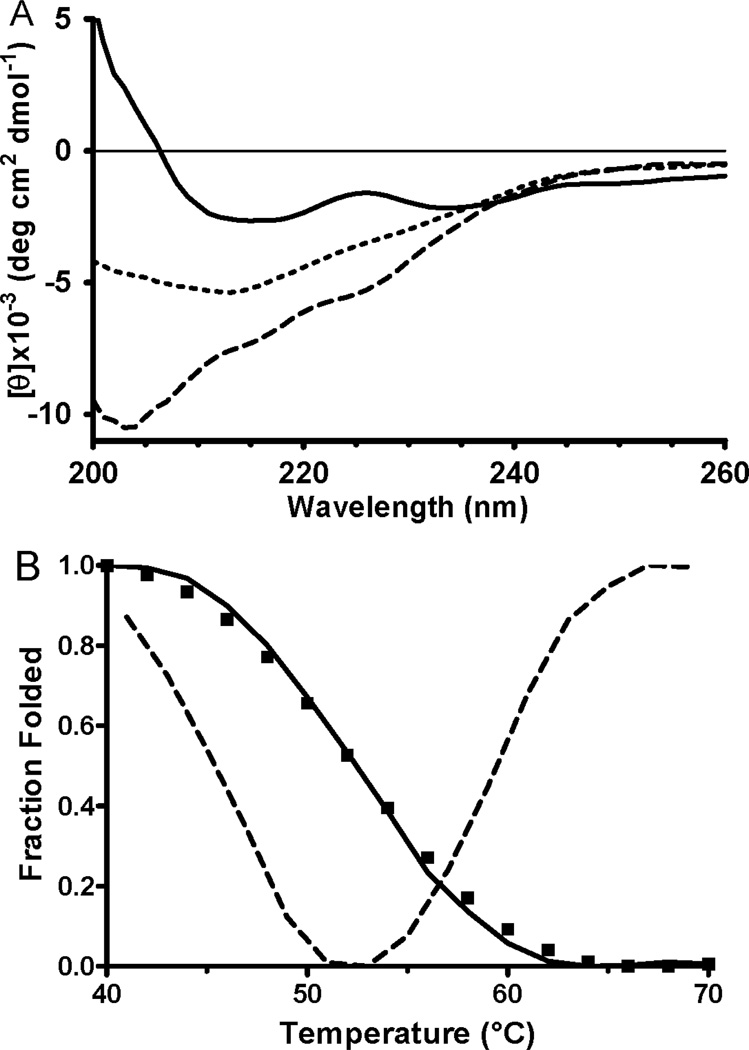
Figure 2.
CD spectra of purified recombinant κI O18/O8 VL and determination of the Tm for the protein. CD spectra of the protein were recorded at a range of temperatures up to 70°C. A. For clarity only three spectra are shown which were recorded at 40°C (solid line), 53°C (short dashed line) and 70°C (long dashed line). B. The values of normalized mean residue molar ellipticity at 205 nm as a function of temperature are shown (solid line) as well as the 1st derivative of that line which was used to determine the Tm (dashed line).

