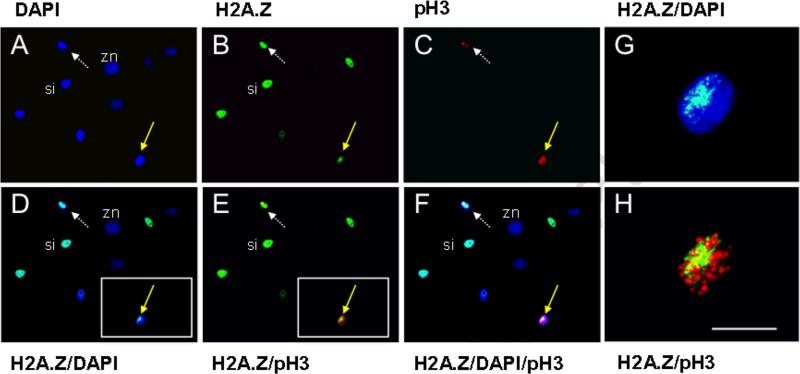
Figure 3. H2A.Z asymmetry in prophase nuclei detected by phosphorylated histone H3 in cultures of wild-type, pre-crises MEFs.
DAPI, nuclear DNA fluorescence. H2A.Z, ISIF with antibodies specific for H2A.Z. pH3, ISIF with antibodies specific for phosphorylated histone H3. ISIF was performed simultaneously for pH3 and H2A.Z. A-C, independent fluorescence images for the indicated markers. D-F, merged combinations of A-C images as denoted. Yellow solid arrows, example of a prophase nucleus with H2A.Z asymmetry. White dotted arrows, example of a prophase nucleus with symmetric H2A.Z. si, example of interphase nucleus (i.e., pH3-negative) with symmetric H2A.Z localization. zn, H2A.Z-negative interphase nucleus. G and H, 10X magnification of nuclear images in the inset boxes of D and E, respectively. Scale bar = 25 microns.

