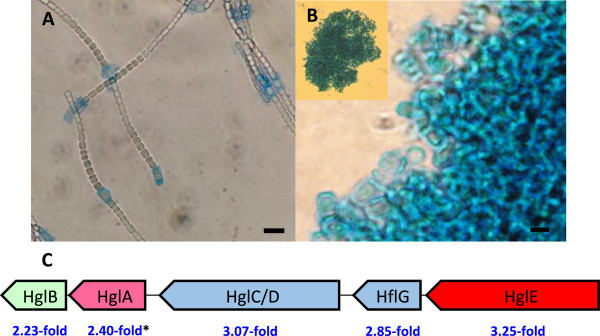
Figure 2.

Visualization of the heterocyst envelope and the cell-type specific relative abundance levels of proteins encoded by the hgl gene cluster. Staining of (A) N2-fixing filaments and (B) the isolated heterocyst fraction from the same diazotrophic culture with (5%) alcian blue. A high degree of heterocyst purity was evident in the isolated fraction. (A) Size bar =10 μm, (B) Size bar =5 μm. (C) All proteins encoded within the hgl gene cluster (Additional file 1) showed higher relative protein abundance in heterocysts. The cell-type specific protein ratios are given as Log2 values (heterocysts/N2-fixing filaments) from samples taken 24 hours after the removal of combined nitrogen. *Indicates that the protein was detected in only one of the two biological replicas.
