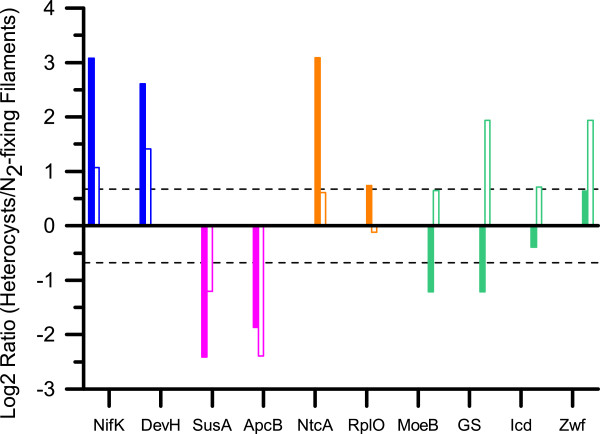
Figure 3.

Transitional changes in the cell-type specific relative abundance of proteins in young and steady-state N 2 -fixing cultures. The transitional changes in the relative cell-type specific abundance of a selected set of proteins quantified in both young (filled bars) and steady-state diazotrophic cultures (open bars) [7]. The color depicts the relative abundance of each protein based on their cell-type specificity in samples from young and steady-state cultures (blue – higher in heterocysts in both samples, pink – lower in heterocyst in both samples, orange – higher in newly formed heterocysts, green – higher in steady-state heterocysts). The dashed horizontal lines depict the Log2 +/-0.678 thresholds of 1.6-fold. Abbreviated protein names are used. For full name, see Additional file 1.
